
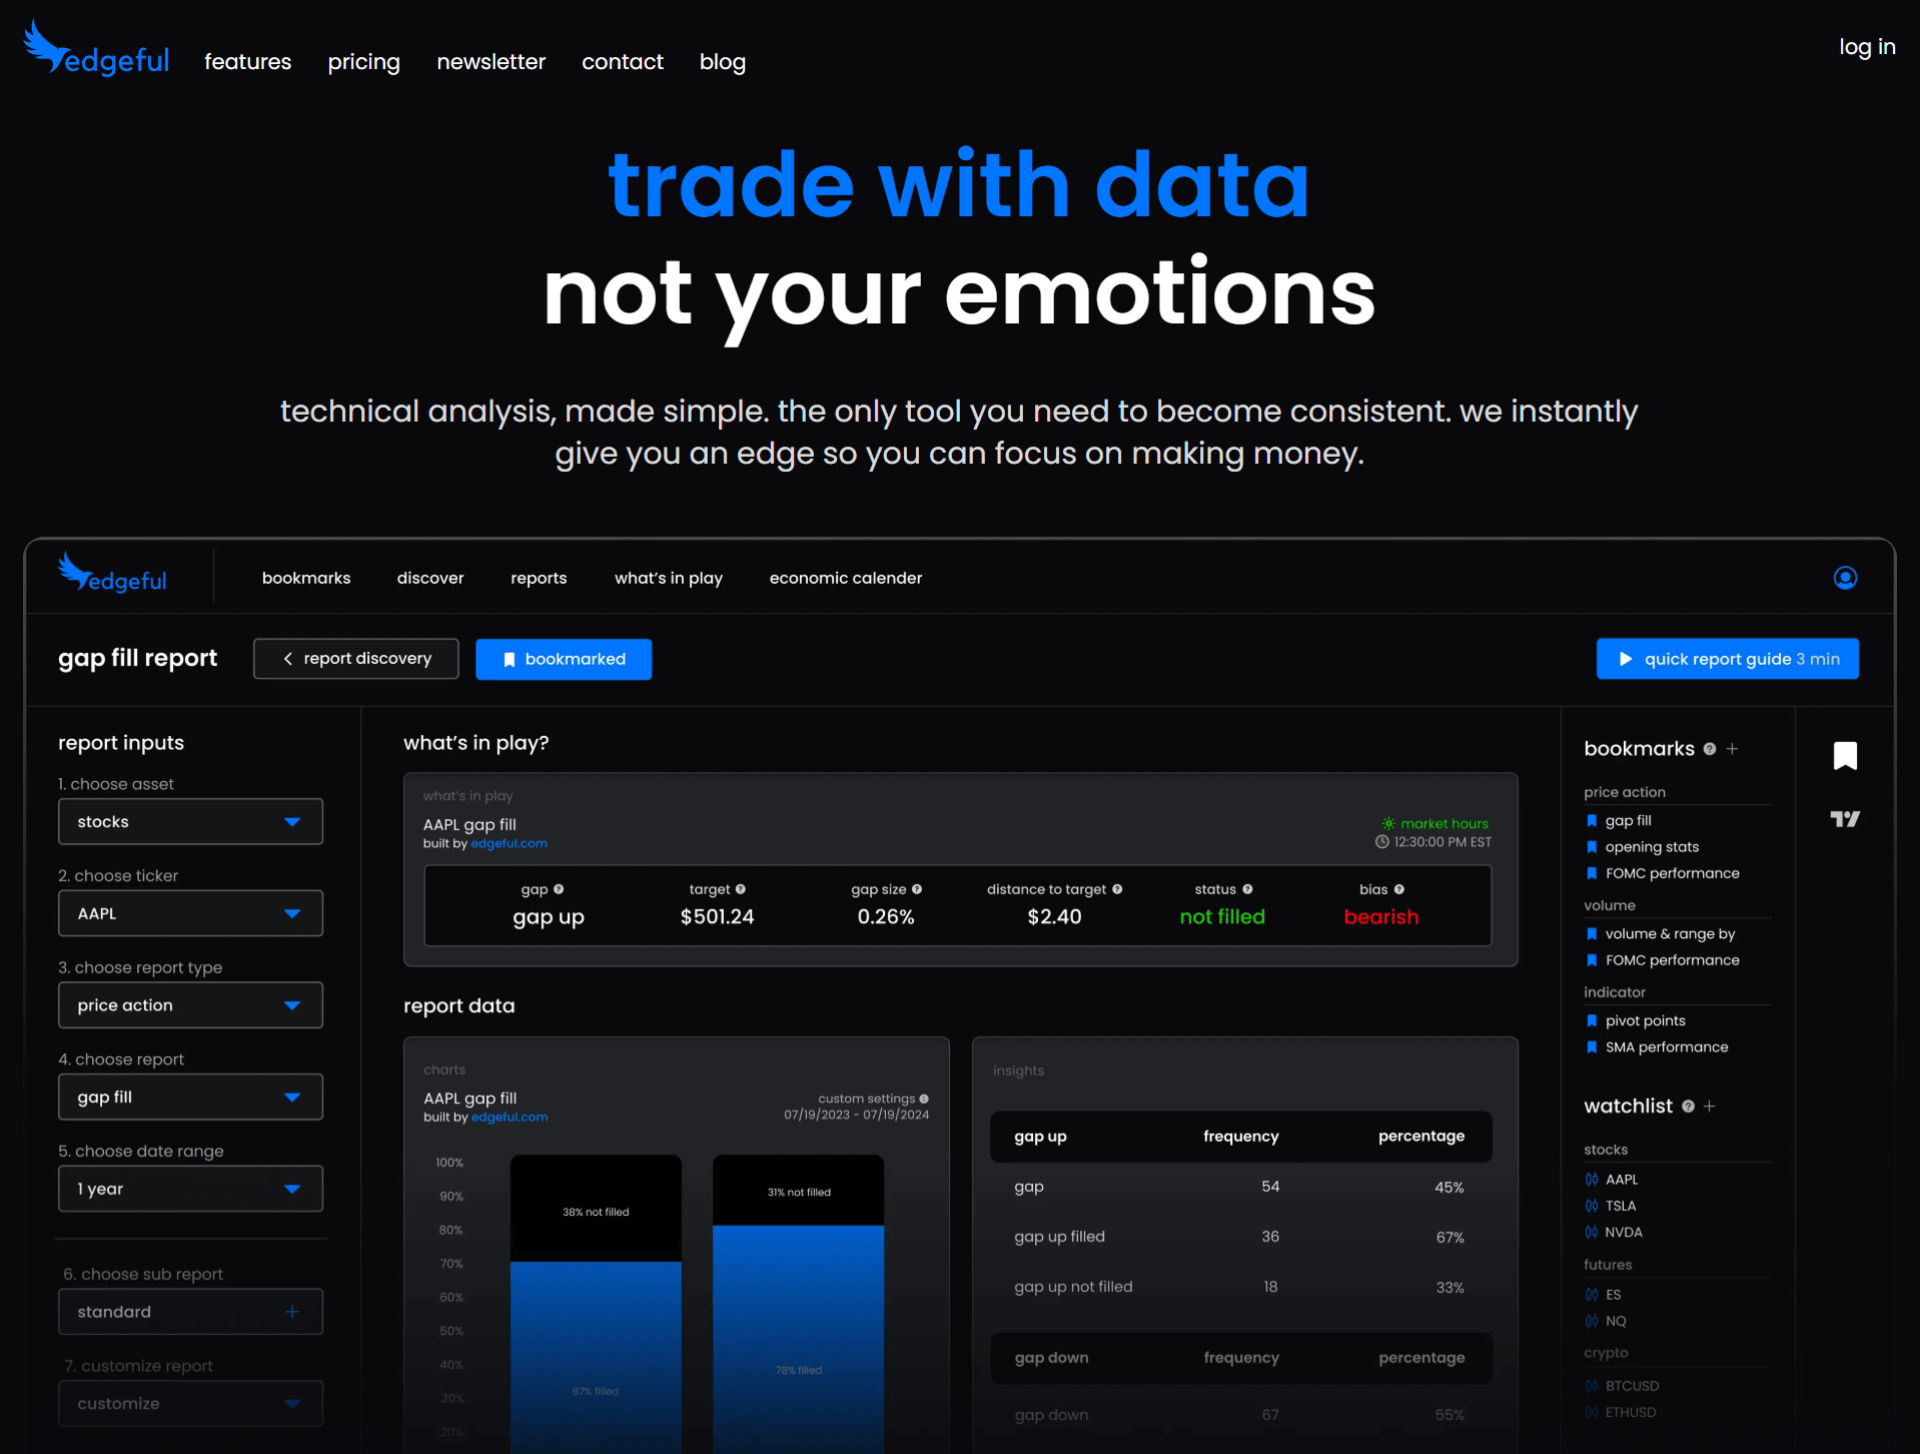
edgeful simplifies data into actionable, well-visualized web-based reports that help you trade based on data instead of your emotions. I have access to the trading tool, reviewed all features and functionalities, and share my findings in this edgeful review. Is edgeful worth it? Let’s find out!
Transparency: We may get compensated when you click on links in this article.
About edgeful
André Arslanian, a former Goldman Sachs analyst and hedge fund employee at Weiss Asset Management, founded edgeful in 2023. edgeful is a trading tool developed for traders who want to make their trading decisions based on reliable historical data. The tool already supports over 3,000+ assets across various asset classes like stocks, ETFs, crypto, forex, and futures contracts.
If you are an active trader who wants to learn more about the profitability of trading strategies like the opening range breakout, gap fills, inside bars, and initial balance breakouts, edgeful is for you. Let me guide you through the tool features to ensure that you are getting a better understanding of what edgeful is all about.
Features
Reports
Over 100 custom-built edgeful reports are well-categorized and cover multiple trading strategies with 5 years of data across 3,000+ assets.
Click on Reports in the navigation menu and then select your asset, ticker, report type, report, and date range. The results will load instantly. You also have two optional settings, a sub-report and an option to customize report variables. Let’s say you love trading the ES (S&P 500 E-mini Futures), and want to evaluate the probabilities for various strategies (also works for stocks, crypto and forex).
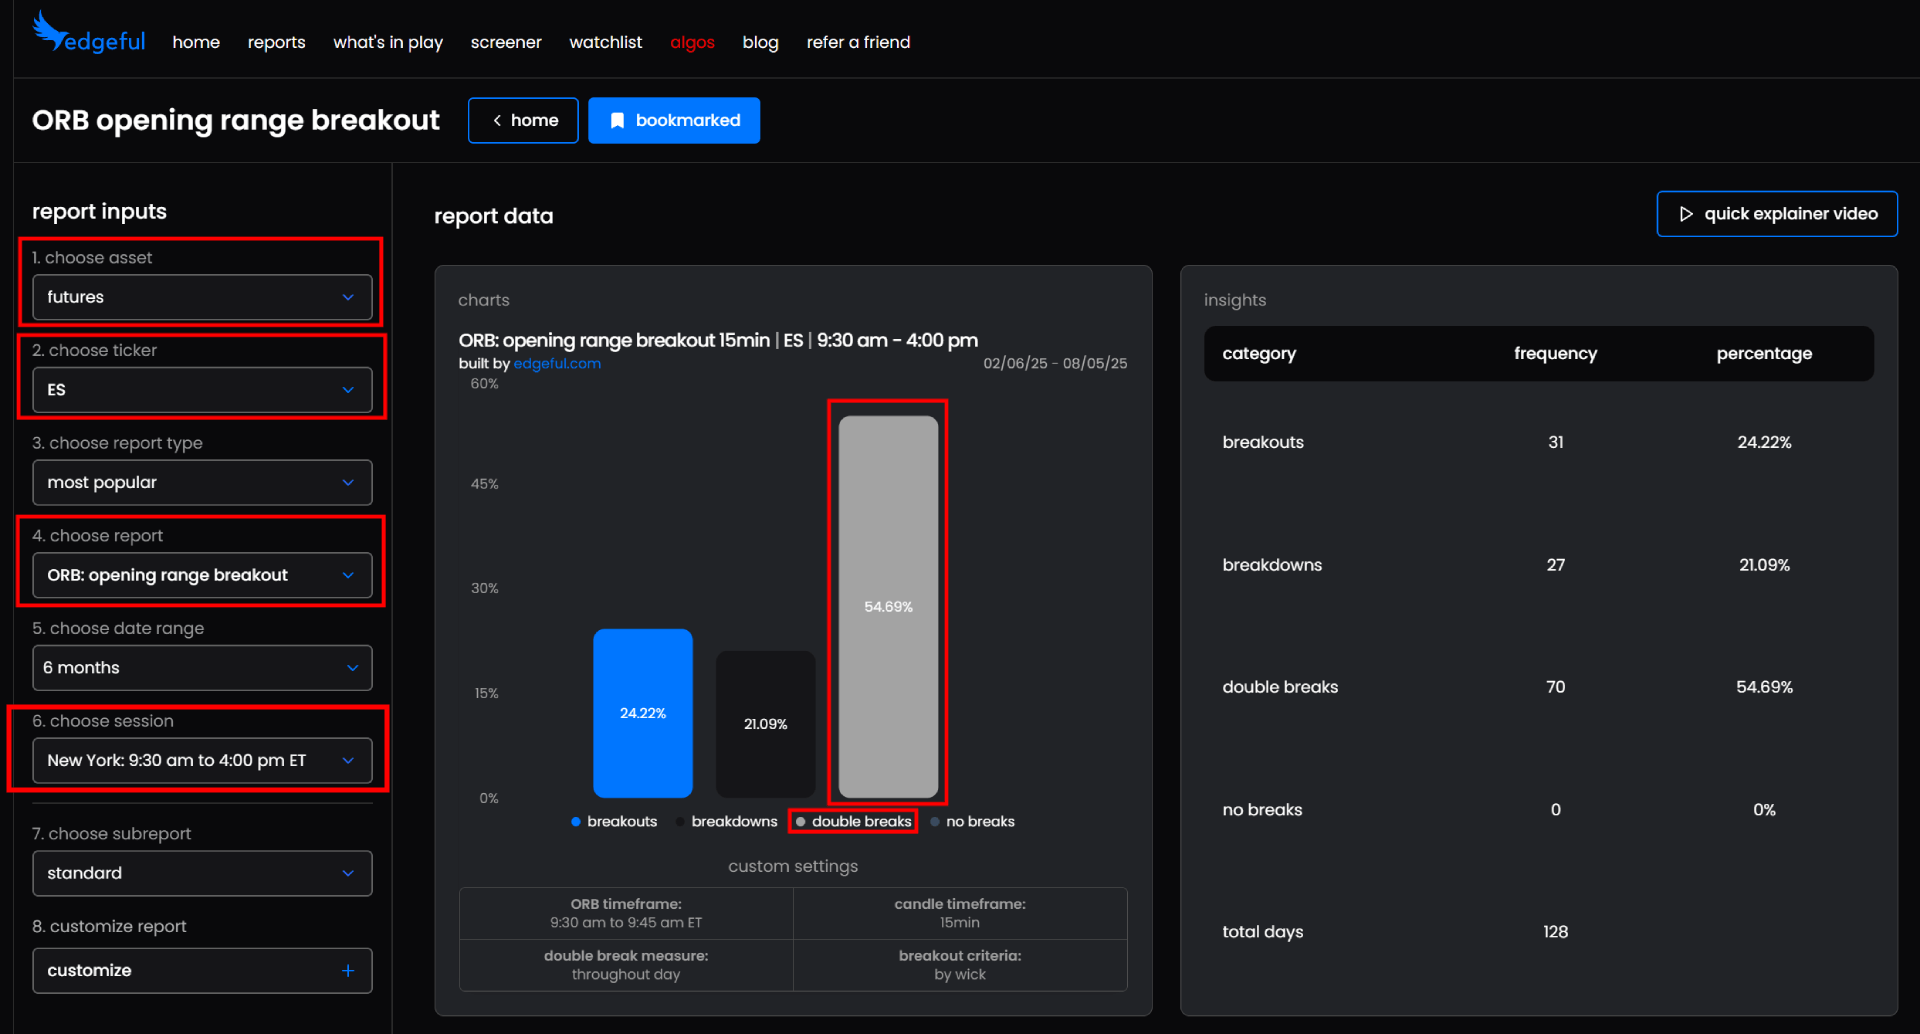
Simply select the asset Futures, choose the ticker you want to analyze (in my case ES), use 6 months of data history for your initial analysis, keep the report type at All Reports, and then find reports that match your trading strategy to see the likelihood of your setup playing out. This way, you have insightful data in seconds without coding or complex Microsoft Excel data analysis.
In my example, I evaluate two breakout types: the opening range breakout on the 15-minute time frame, and the initial balance breakout on the 60-minute time frame (I use the New York regular trading hours session because the CME, where the ES is listed is an U.S. market).
I see that the opening range gets broken on both ends in 54.69% of cases. This clearly indicates that the market does not find a clear direction when breaking the 15 minute high or 15 minute low.
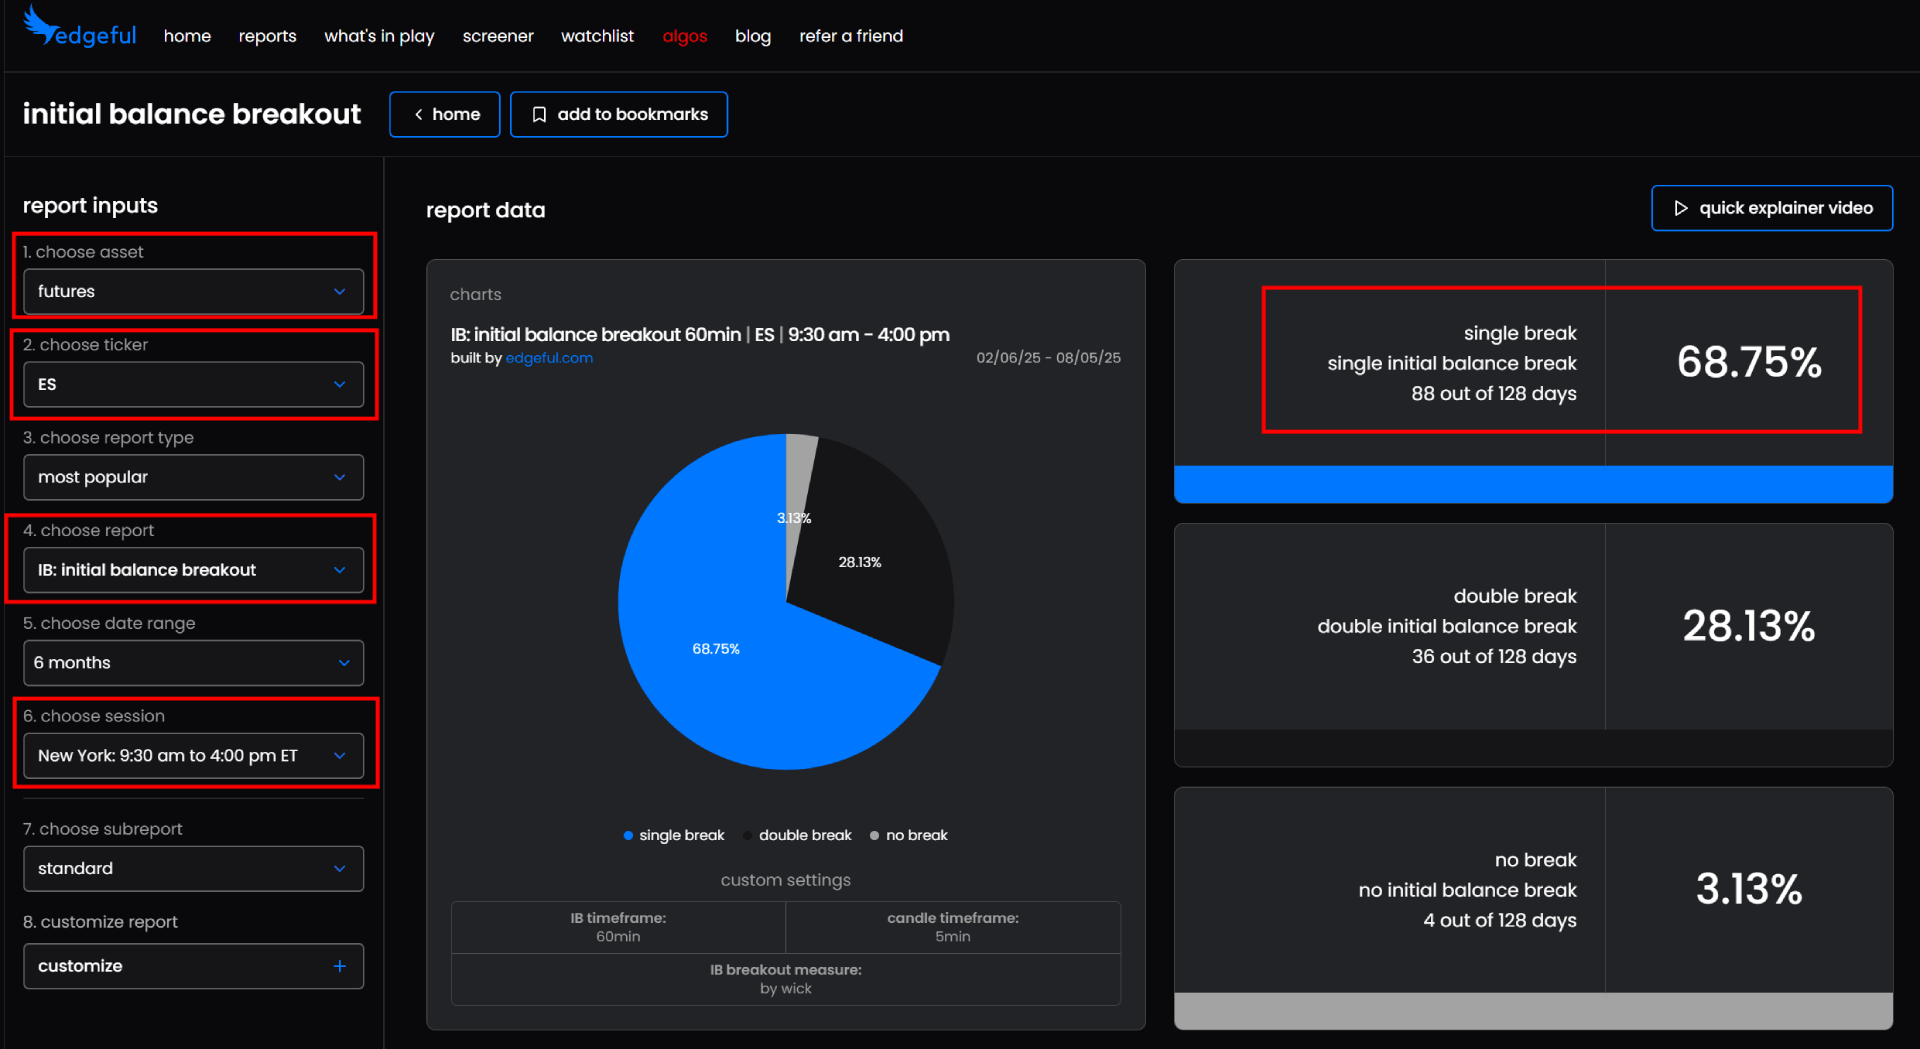
The initial balance (the breakout of the 60 minute opening range) only double breaks in 28.13% of times. This indicates that the market typically trends in the direction of the initial balance breakout, so that if one side of the initial balance breaks, it is unlikely that the market reverts entirely to the opposite side.
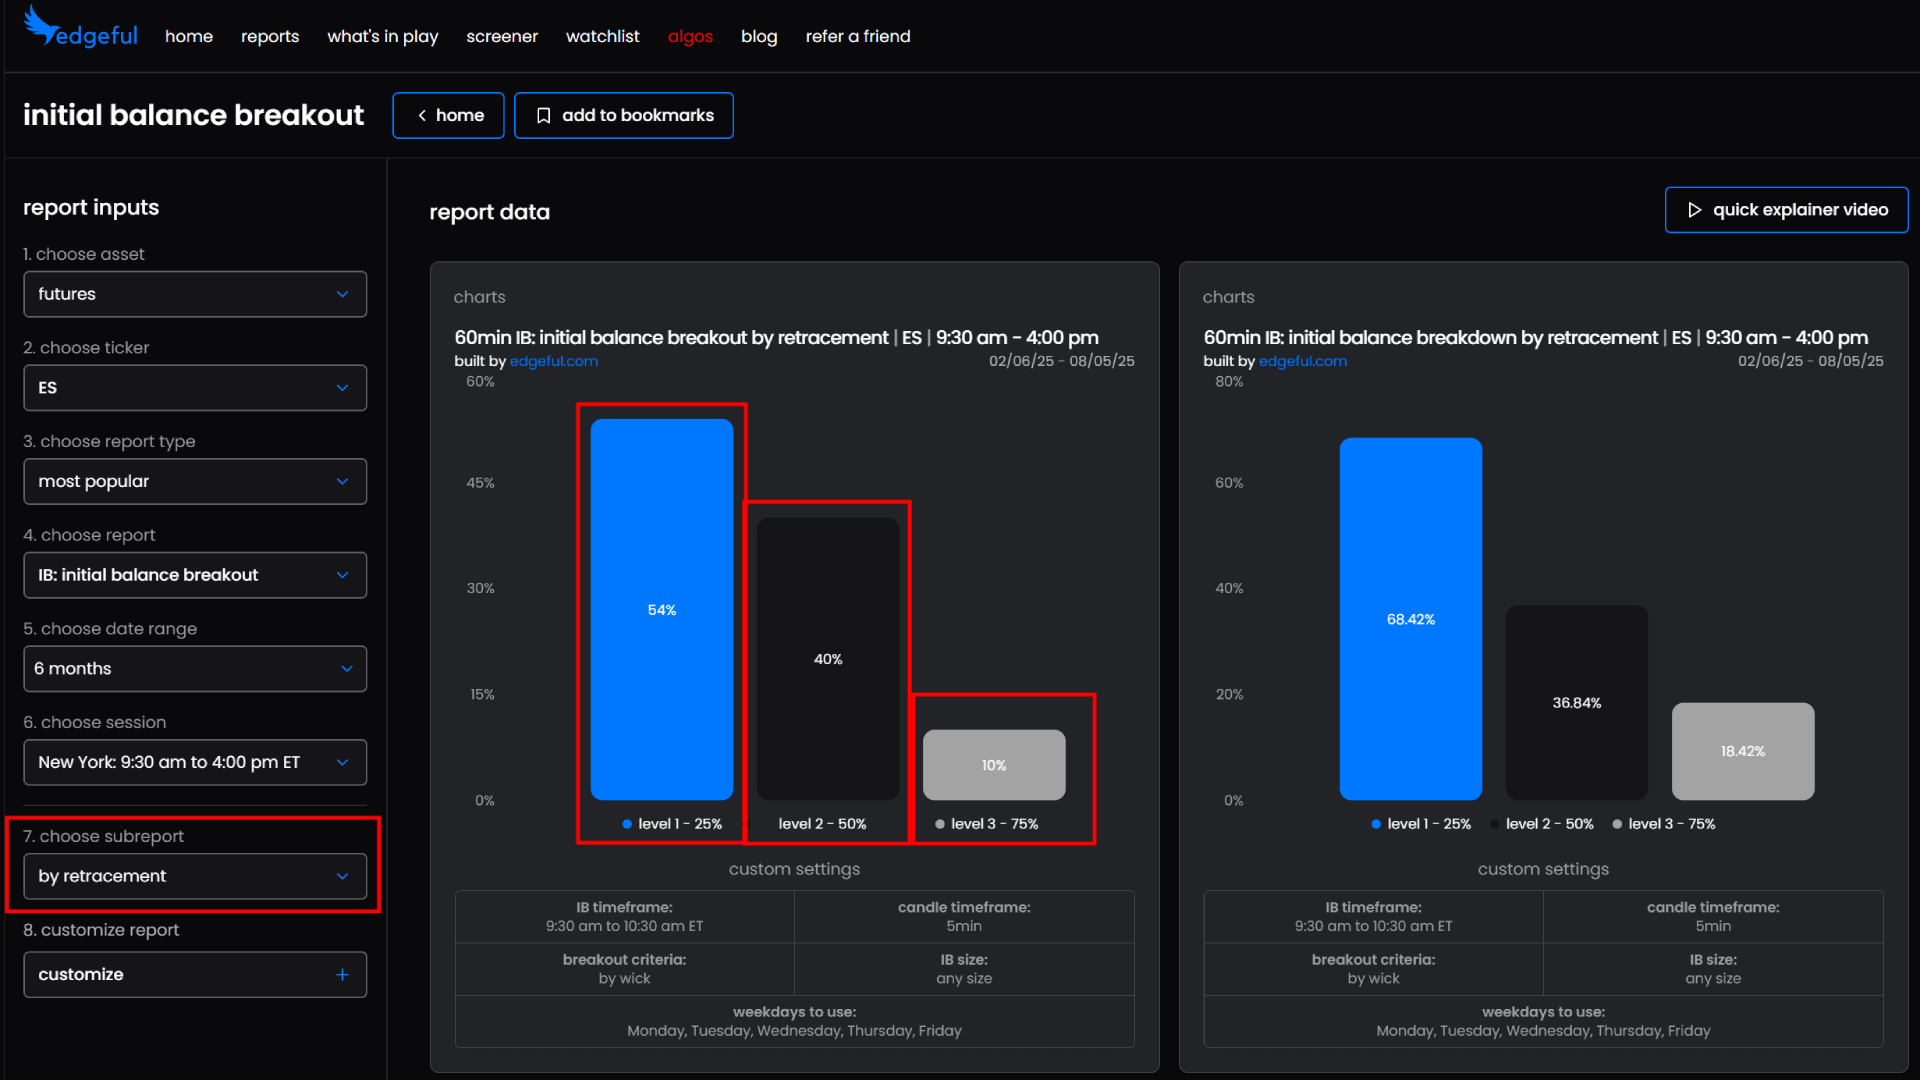
And now, I can get into more details. For example, I can sub-categorize the initial balance breakout into the percentage retracement levels that the price typically retraces back to after breaking out. I see that in 54% of breakouts to the upside, the price retraces back to the upper 25% level of the initial balance range. I see that in 40% the price even retraces back to the 50% level, and I also see, that only in 10% of cases the price retraces back to the 75% retracement level. Besides, I have the information for the breakdown too. This data helps me to understand if it is reasonable to wait for a retracement after a breakout or breakdown for better entries and higher profitability scores.
This is only an ultra-small sample of what you can do. There are 100+ pre-configured setups you can check the probabilities for, and you can even customize reports if needed further with breakout criteria, time frames, weekdays, profit target levels, and more.
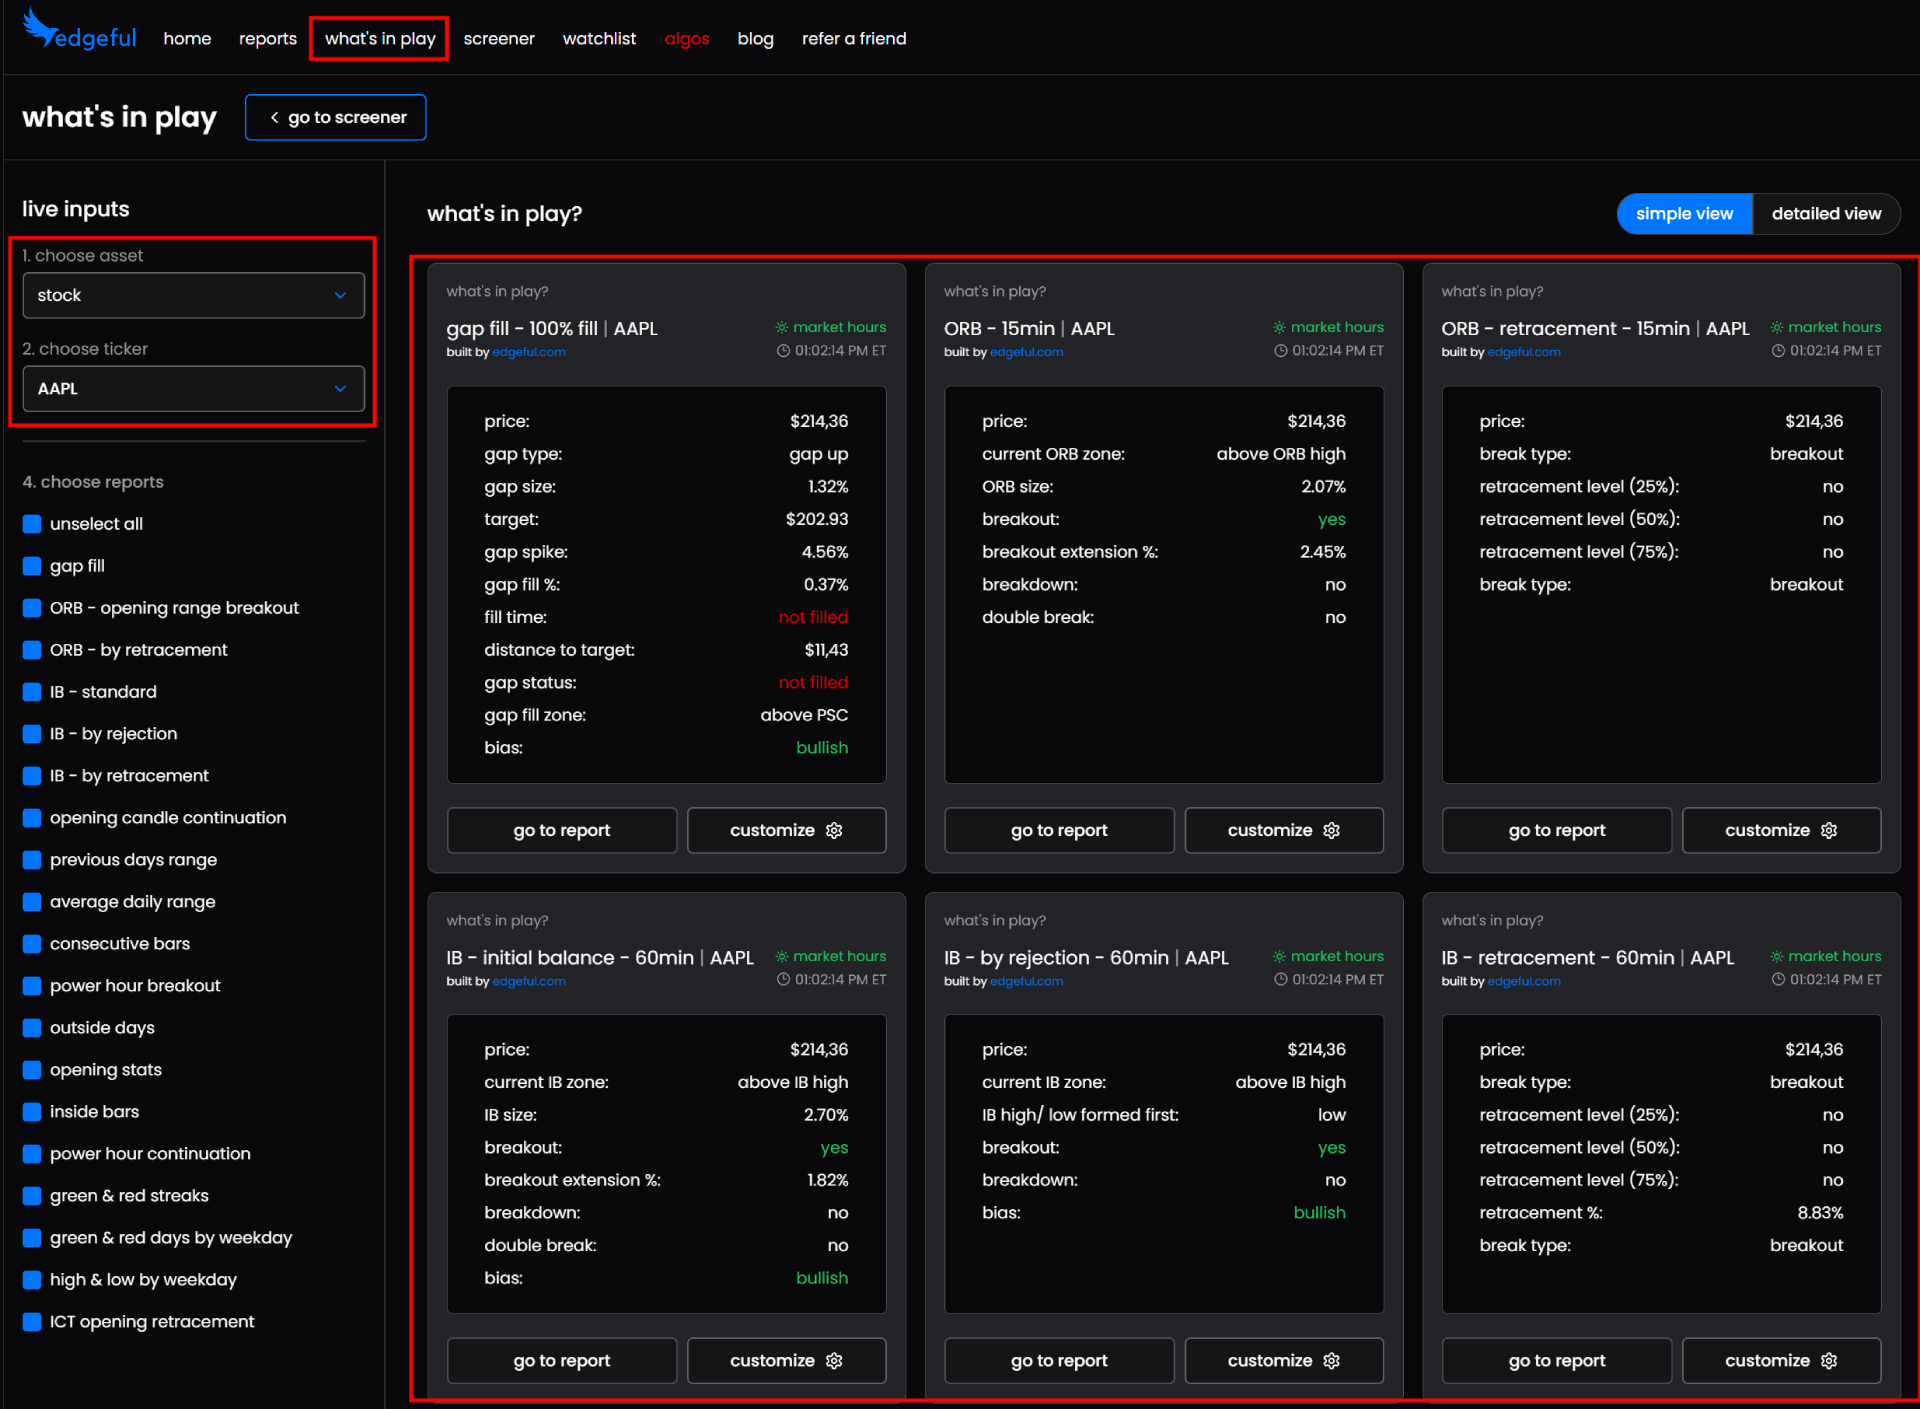
What’s in Play
The What’s in Play feature helps you differentiate between setups that have been triggered and those that are still without signal today. All you need to do is select a ticker across stocks, futures, forex, and crypto markets and enjoy the convenient visualization.
This feature is helpful if you quickly want to identify which high-probability setup might trigger next for your favorite asset. Here is an example of whats in play for the AAPL stock:
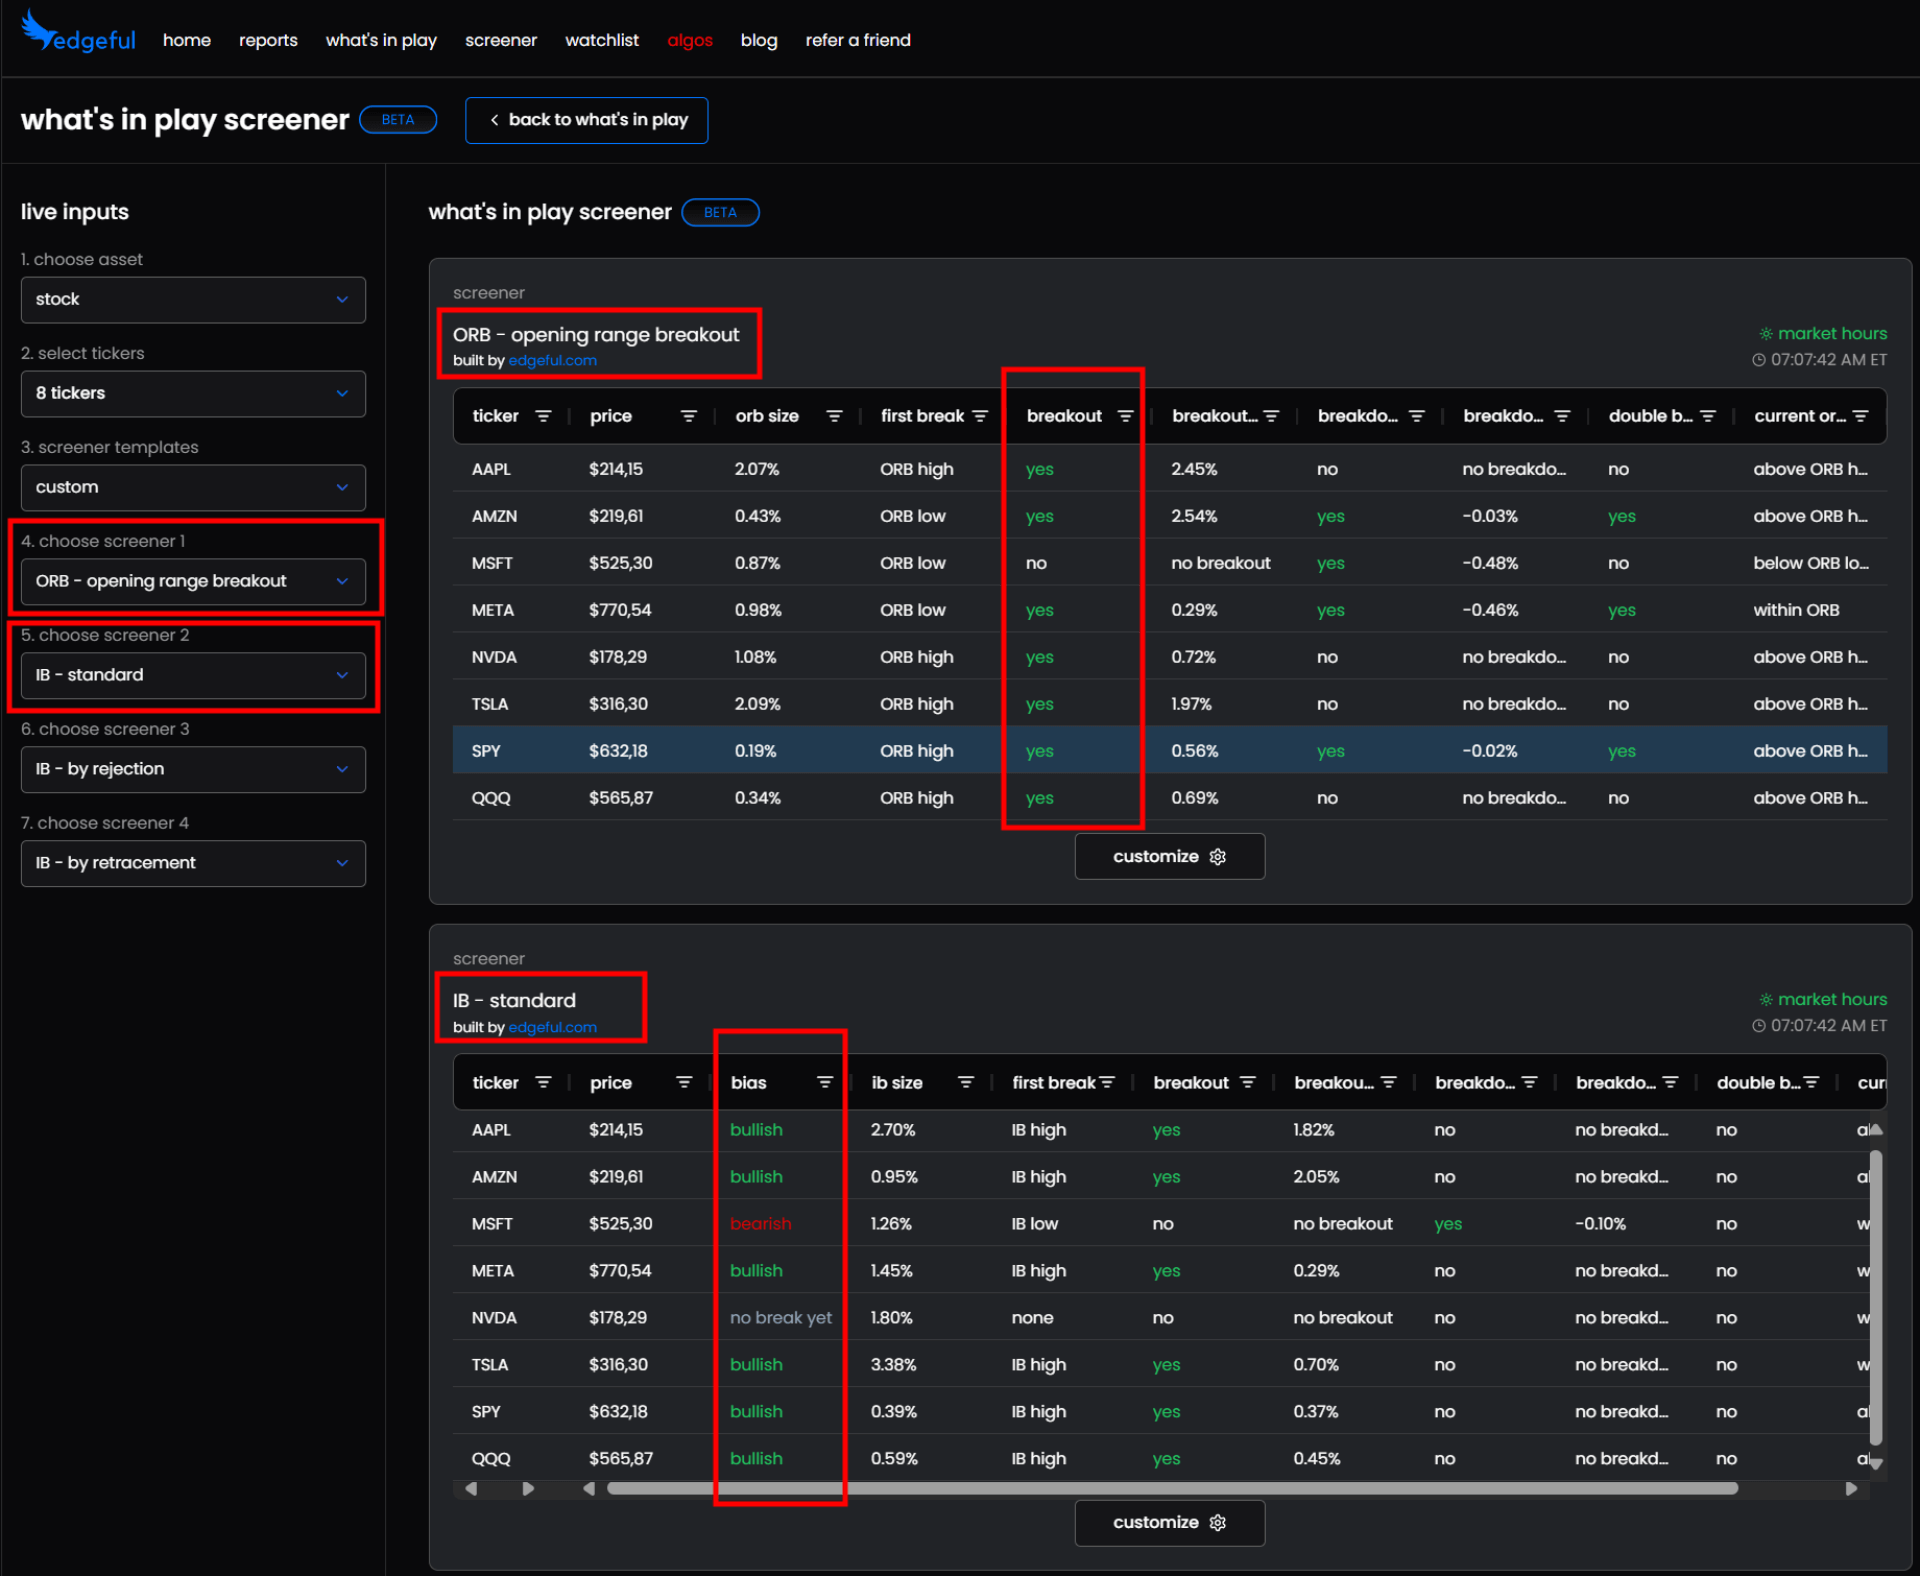
Screener
The idea of the edgeful screener is to give users a helpful 360° view across market leaders. Here, you monitor the main strategies Gap Fill, Opening Range Breakout, Initial Balance, and Opening Candle Continuation across all tickers.
Let’s say, you see that all 7 stocks and both indices are all green across all strategies, you know that you should better not fight against the market direction by shorting stocks. Similar to the opposite side, when you see the indices and most stocks in the red for all strategies, it implies that it is better to avoid long positions. And if you see mixed signals across the assets, it could be a non-trending day where the markets try hard to find a direction, which can be a day where it’s better to turn off the computer.
Example: I’ve selected 8 stock tickers, including indices, and I’ve selected the opening range breakout and the initial balance bias. I see 7 out of 8 with a breakout to the upside, and I see 6 out of 8 times the breakout of the initial balance to the upside. This indicates bullish momentum and based on the indications of separate reports, I know that it is more likely that the market stays green for the day with pullbacks but a tendence to the upside.
Watchlist
Here, you define your personal watchlist. This is pretty helpful if you want to use the bookmark navigation feature. On the right side of your edgeful dashboard, you can add your favorite setups and your watchlist to quickly scroll through your favorite trading setups and stocks.
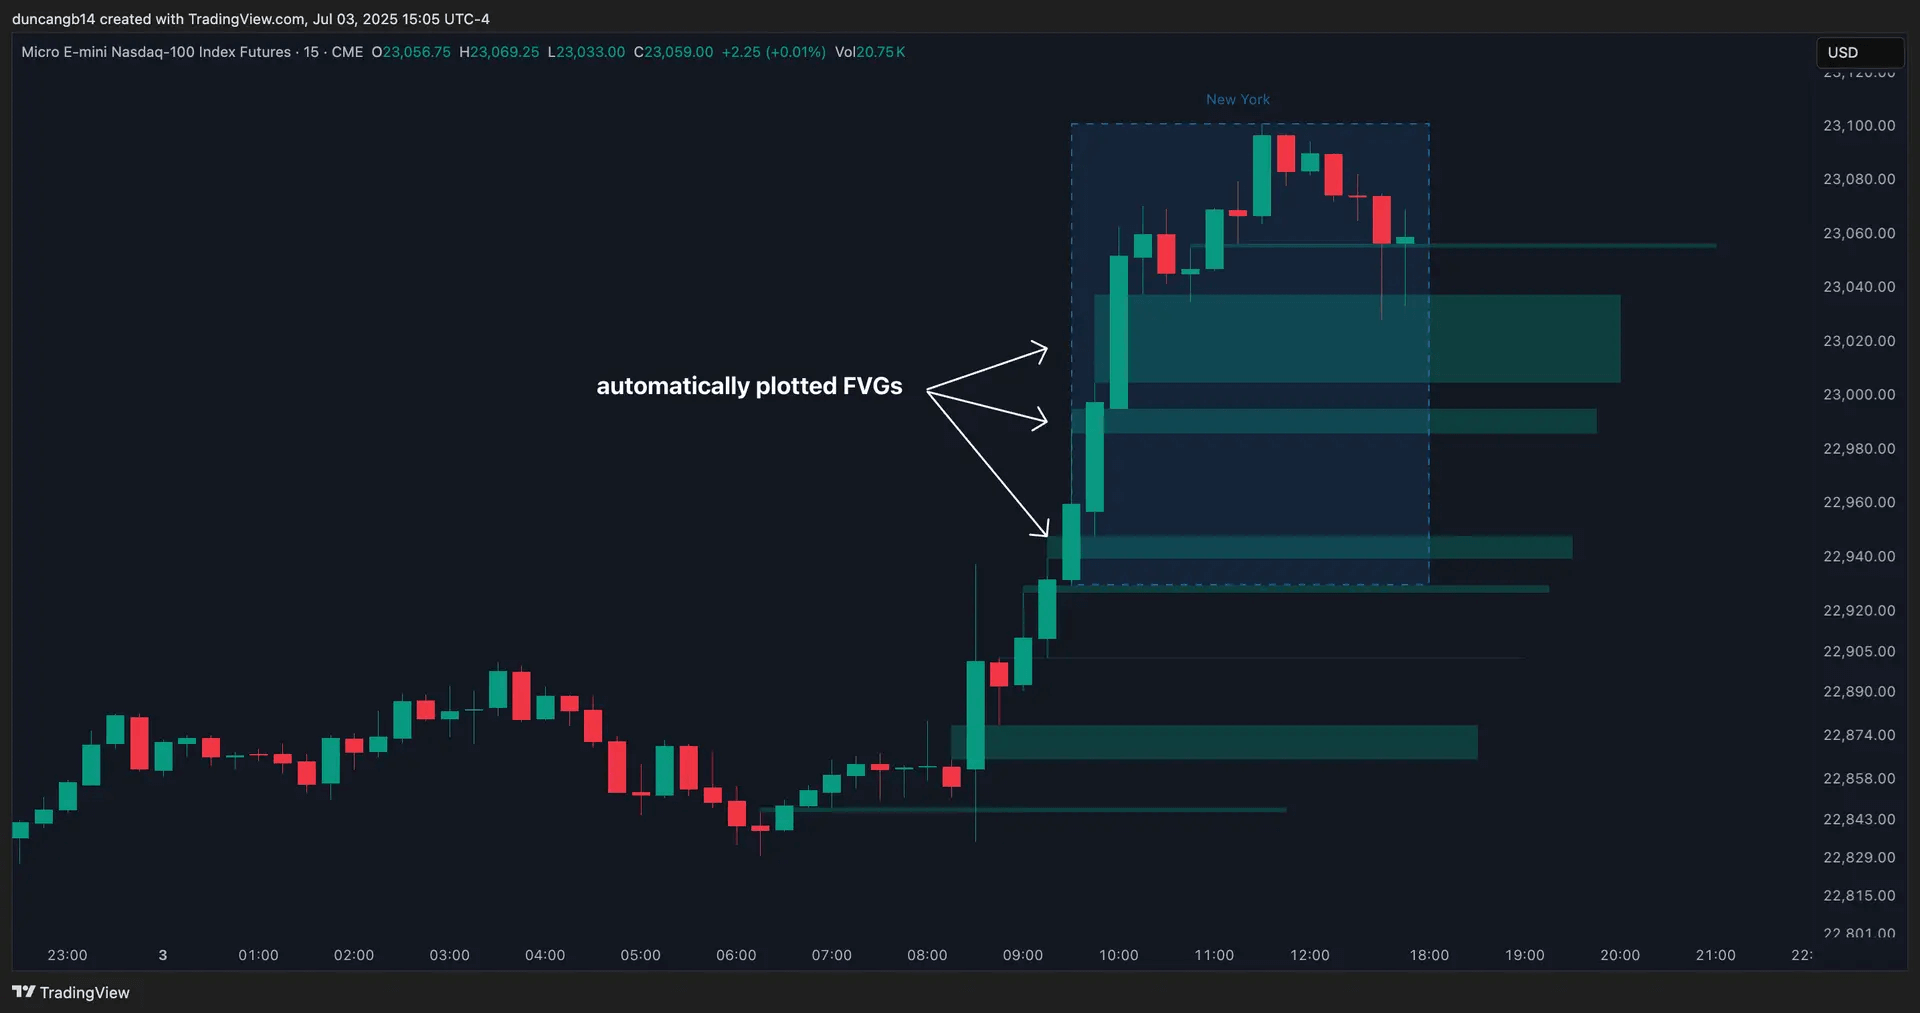
TradingView Indicators
A tremendously helpful feature is the visualization of trading strategies via TradingView. So, in the first step. edgeful converts raw data into tables and graphs, which is already helpful and without a competitor offering similar features for retail traders. The free TradingView indicators for subscribers add additional value by visualizing the strategies applied to your charts.
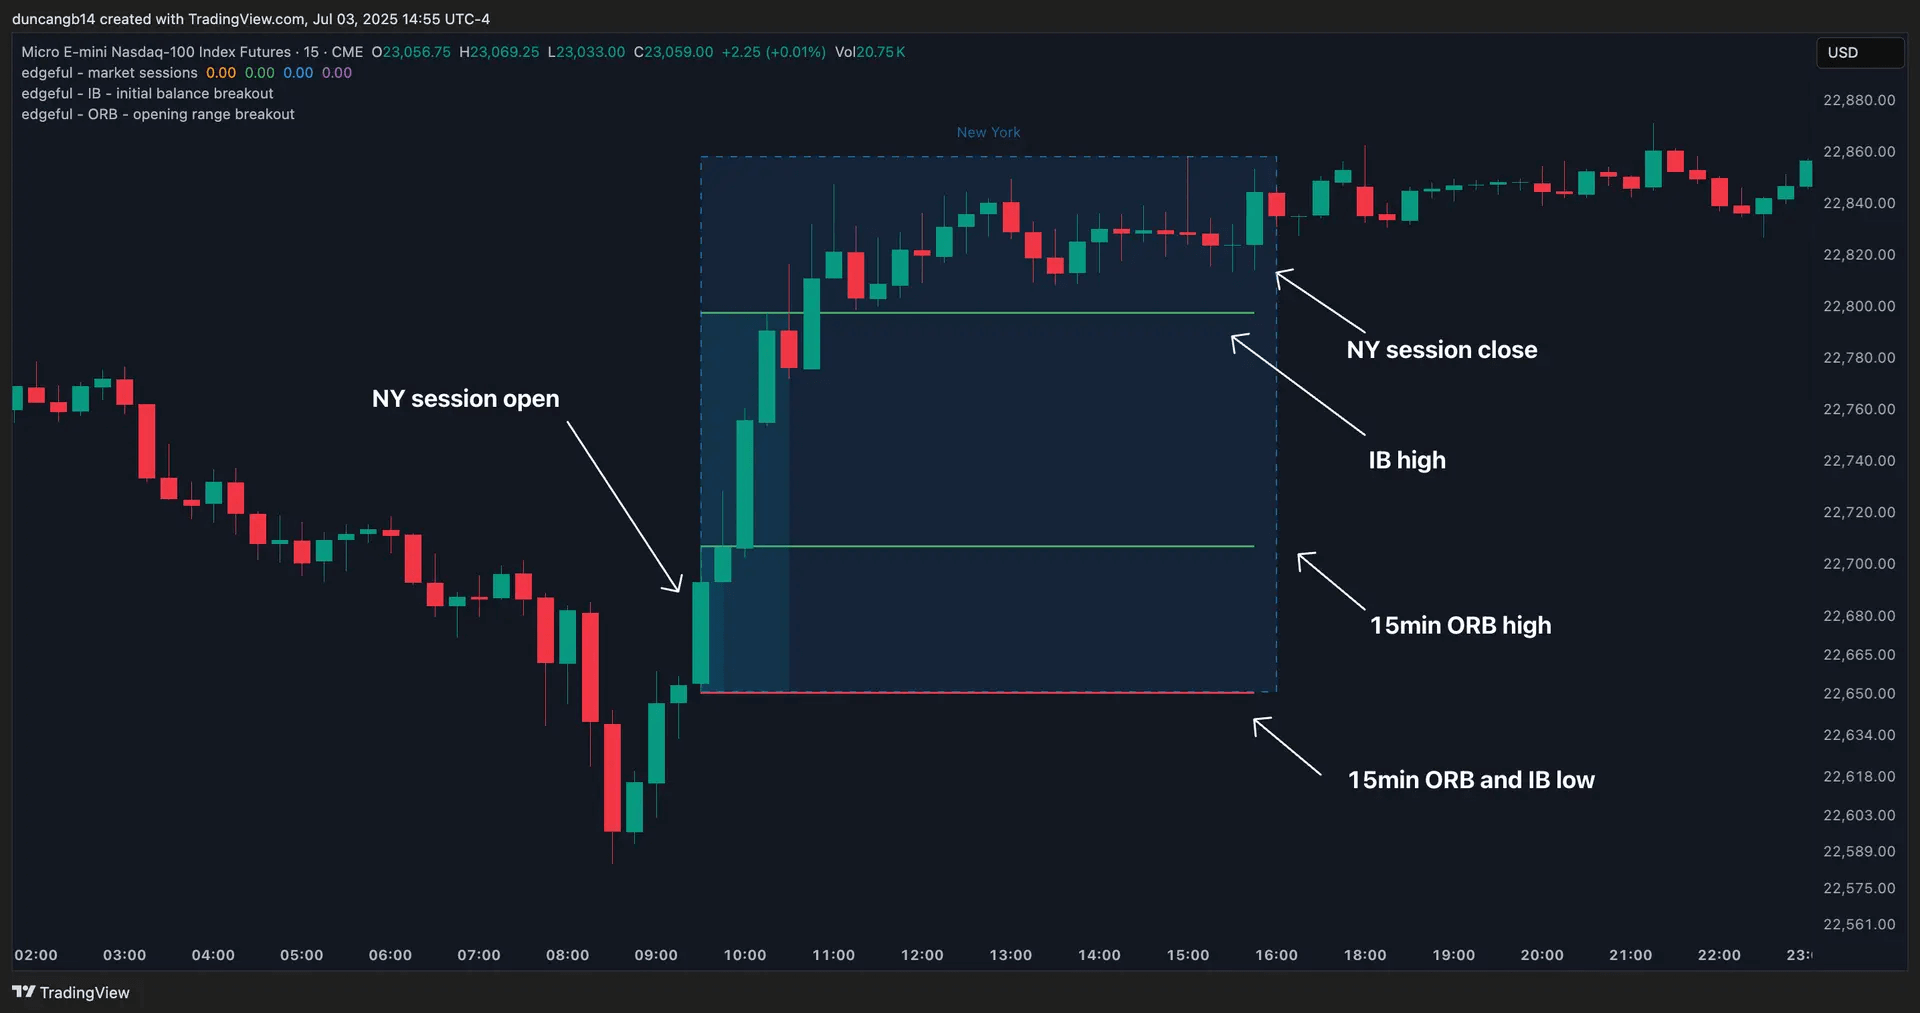
You can apply the strategies as an indicator and then scroll back to see how a strategy in the chosen time frame would have worked. If you like, you can use a free TradingView to connect, but you’ll have higher data accuracy if you use a paid TradingView version with real-time market data for all major exchanges in the United States.
NinjaTrader Indicators
Alternatively to TradingView, you can use the indicators with the NinjaTrader platform.
Algos
The algo’s features let you connect edgeful with TradingView for real-time trading strategy tracking. You can currently apply 3 strategies: the Gap Fill, Opening Range Breakout (ORB), and Initial Balance. The system will indicate when to enter, when to exit, and when to stop out of a trading position with real-time alerts (the alerts can go through your phone or to TradingView).
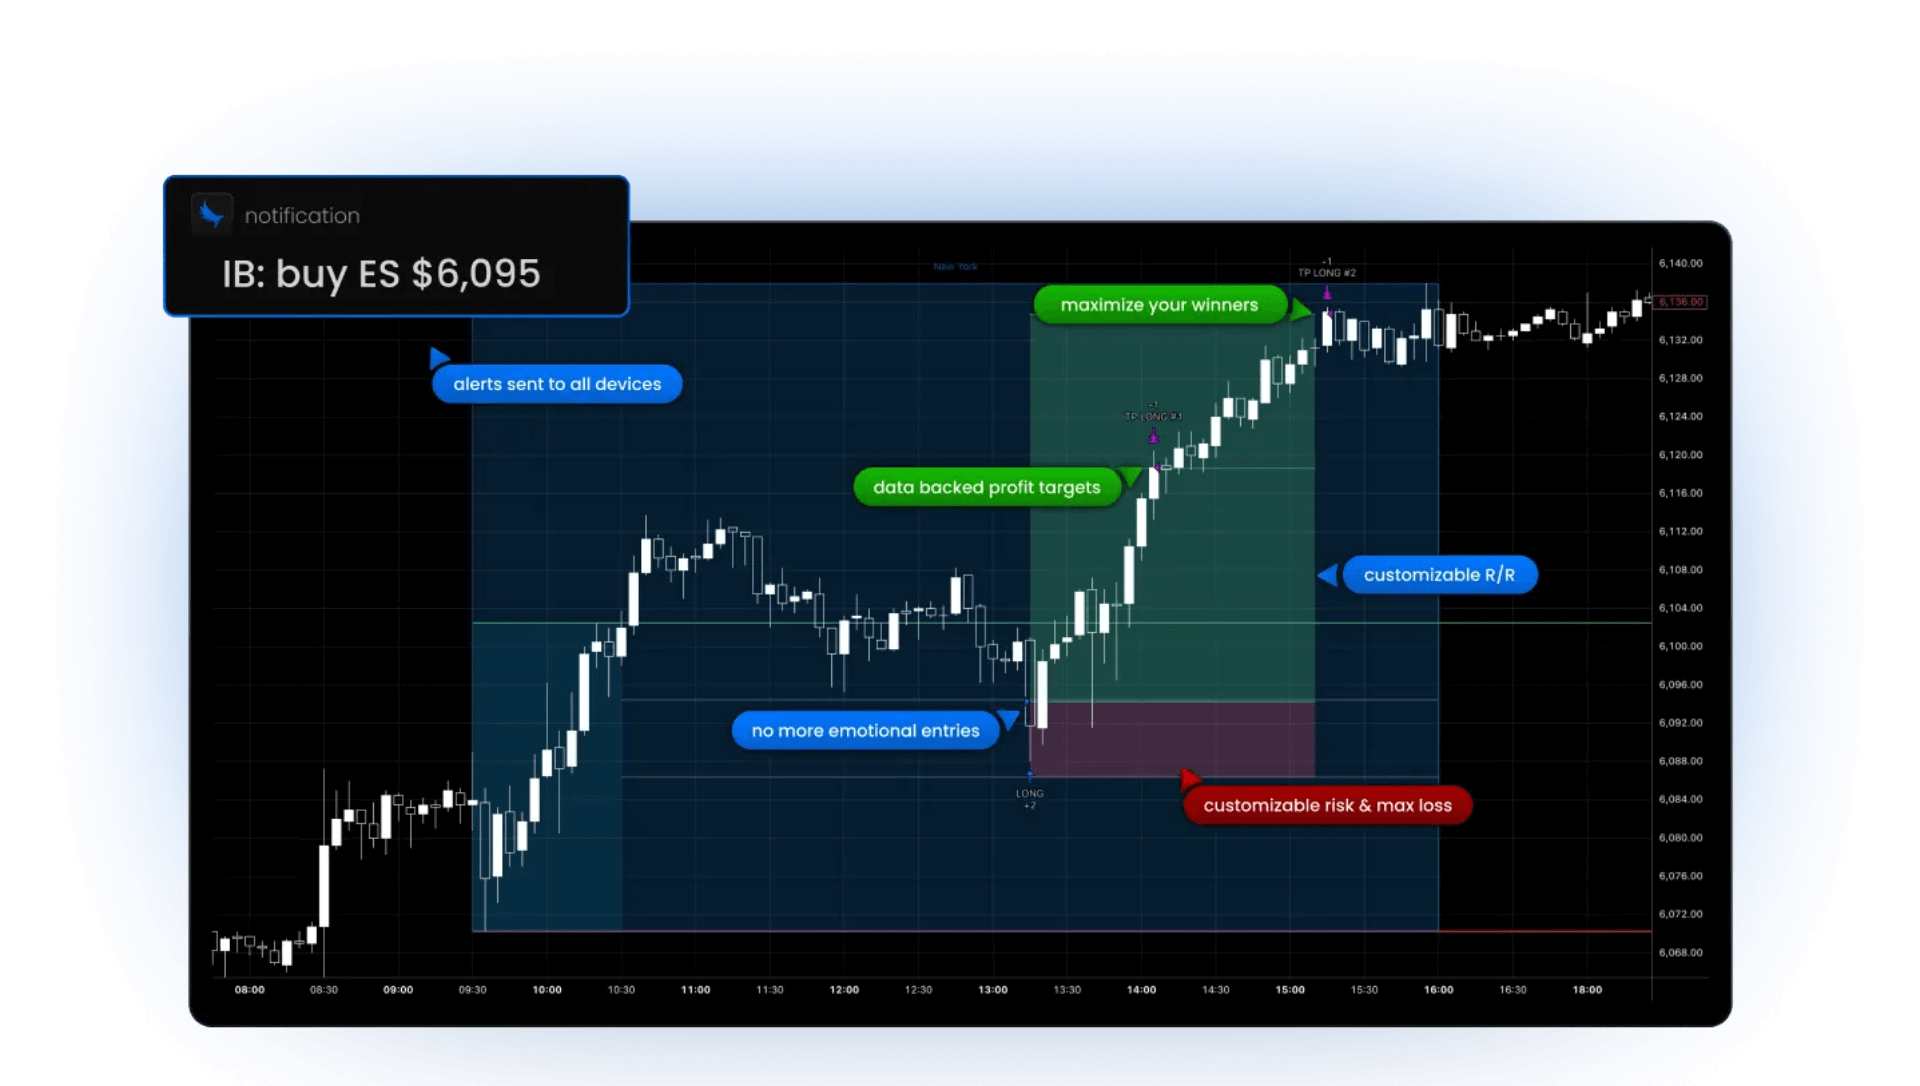
The difference to the free TradingView indicators is that the indicators only indicate the trading strategy outcome in the past, while the Algos feature sends trading signals in real-time. Soon, you can even use automated trade executions via edgeful and TradingView, and there are plans to add more algos soon.
Costs
The monthly edgeful subscription with access to all data and visualizations, including TradingView and NinjaTrader indicators, costs $49. Optional, you can save 20% by paying $468 in advance for a full year (equals $39 monthly).
The algos feature for real-time trading signals is entirely optional and costs $299 monthly.
Discount
You save 20% when subscribing a full year
Getting Started with edgeful
It is highly recommended to start with the 10 onboarding videos. Begin with the How to take a trade using Edgful video (15 minutes) and continue with the 5 key feature videos (about 5 minutes each), and then watch the Using edgeful daily, How to use edgeful’s TradingView indicators and How to join the edgeful discord videos (also about 5 minutes each).
The about one hour of video lessons is well-invested and helps you to start using edgeful in the most efficient way. André does a really good job here, explaining everything with samples live using his tool.
Bottom Line
edgeful greatly transforms raw probability data into easy-to-understand graphs and visualizations. Instead of manually calculating trading strategy success rates, you simply open the tool, select an asset of your choice, and check what’s currently working in the market environment.
The accessibility of over 3,000 assets, including asset classes of stocks, futures, forex, and crypto with intraday time frames, makes edgeful a helpful tool for active traders. Considering that a trading system developer costs $200 per hour, the monthly subscription price of $49 is fairly balanced.
FAQs
What Type of Trading Tool Is edgeful?
edgeful is a web-based data analysis tool. It combines thorough data with backtesting algorithms for specific trading strategies. It helps you identify the most profitable trading strategies across various asset classes.
Do I Need TradingView to Use edgeful?
No. Using TradingView together with edgeful is optional. If you like, you can connect a free TradingView account with edgeful, to use their free premium charting for trading strategy visualization.