
Koyfin was founded in 2016 by Rob Koyfman, a former Wall Street professional who had spent years working on overpriced, outdated data platforms and concluded there had to be a better way. The platform launched its first product in 2018, reached 500,000 users by 2023, and has been backed by Social Leverage, Craft Ventures, and Valor with over $6 million raised across two seed rounds. The mission stated on their own site is direct: equip every investor in the world, regardless of portfolio size, with the best data and tools available.
That mission shapes everything about how Koyfin is priced and built. It is a global market analytics platform covering stocks, ETFs, mutual funds, fixed income, currencies, commodities, indices, global economics, transcripts, crypto, and news — all in one place, starting at $0. For investors who have been piecing together data from a stack of browser tabs, that consolidation alone has real value. The depth behind it is what earns the subscription fee.
Equity Screener
The screener covers 100,000+ global securities across 5,900+ filter criteria. That is not a typo. The universe is larger than any other screener covered on this site, and the filter library is genuinely extensive, spanning price, valuation, growth, profitability, momentum, analyst estimates, technical indicators, and more. For investors with a global mandate, or anyone screening beyond the standard US large-cap universe, this is the standout feature.
Results run on up-to-the-minute data. Screeners can be saved, refined, and revisited. The breadth of the filter library means investors can screen with the same level of specificity they would bring to a fundamental model, not just basic ratio cutoffs.
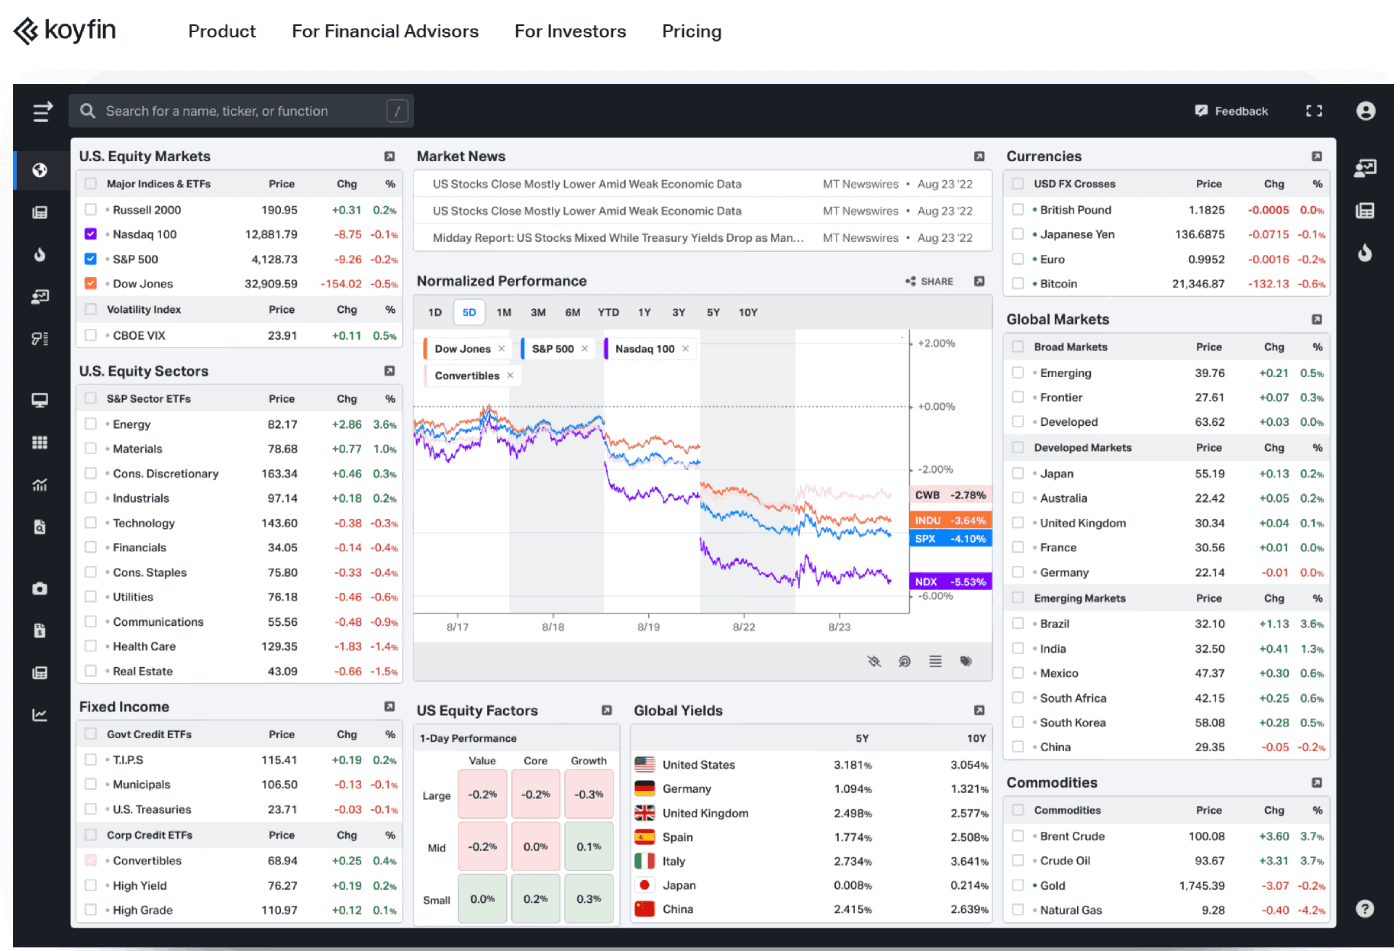
Dashboards and Data Coverage
The dashboard system is where Koyfin earns its reputation for customizability. The interface is fully configurable: layout, color themes, panel arrangement, and the data displayed in each panel are all adjustable. Tickers can be dragged in from the sidebar. New elements can be added to a dashboard with a single click. The result is a workspace that reflects how a specific investor actually thinks, not a generic layout imposed by the platform.
Macro Dashboards are pre-built models covering broad aspects of the financial landscape: yield curves, economic indicators, cross-asset performance, and market conditions. Live government bond yields from 40 countries are included. Global economics data spans country-level indicators that affect asset prices across markets. For investors who approach stock selection through a top-down macro lens, this is data that most screeners on this list simply do not offer.
Data coverage on the homepage lists 11 asset classes: stocks, ETFs, mutual funds, government yields, indices, currencies, commodities, global economics, transcripts, crypto, and news. The worldwide coverage extends to 80,000+ companies globally. North American coverage adds depth with ETFs, mutual funds, closed-end funds, options, and short interest data. Company transcripts go back 50 years and are searchable by keyword, which means investors can search every earnings call for a specific term across a company’s entire history.
Charting and Financial Analysis
The charting suite supports hundreds of technical indicators alongside fundamental and valuation measures. Analyst price targets and consensus earnings estimates can be overlaid on price charts. Charts can be shared via link, downloaded as PNG, or embedded via iFrame into external websites. The graphing tools are built to handle both bottom-up fundamental analysis and top-down macro visualization within the same interface.
The Insight Panel displays detailed financial data per company: historical financials, income statements, balance sheets, cash flow, analyst estimates, and filings. The financial analysis view presents historical data in a format that makes trend identification straightforward, with projection data available on paid plans. Watchlists are exportable as CSV files.
Alerts and Portfolio Tracking
Alerts cover price changes, valuation shifts, technical signals, and news updates across watchlists and portfolios. Individual investors can set alerts for specific securities, which functions as a practical monitoring system for concentrated positions or thesis-based triggers.
Portfolio tracking is built around watchlists tied to custom dashboards. Positions are tracked in real time once added. The platform is designed to replace the spreadsheet-and-browser-tab workflow that most self-directed investors default to, consolidating watchlist monitoring, financial data, news, and macro context into a single configurable view.
Who Koyfin Is For
Koyfin explicitly serves three audiences on its own site: individual investors, financial advisors, and investment research teams. The product experience differs meaningfully by tier. Individual investors on the Plus plan ($39/month) get the screener, 10 years of financials, 100,000+ company snapshots, press releases, filings, and transcripts. That is the tier where the platform’s core value unlocks for a self-directed investor.
Financial advisors get dedicated functionality from the Advisor Core tier ($209/month) upward: model portfolios, client proposals and reports, custodian integration, and mutual fund data. These are not features that individual investors need, and the pricing reflects that segmentation clearly. Mutual fund data is not available below the Advisor Core tier. That is a real limitation for investors who want to screen mutual funds alongside equities.
Pricing
| Plan | Monthly | Best For |
|---|---|---|
| Free | $0 | Market dashboards, basic watchlists, 2 years financials |
| Plus | $39 | Individual investors: full screener, 10Y financials, transcripts |
| Premium | $79 | Advanced portfolio analytics, custom formulas, ETF valuation |
| Advisor Core | $209 | Financial advisors: client reports, custodian integration, mutual funds |
| Advisor Pro | $299 | Multi-custodian, custom report pages, 200 client reports/month |
Annual billing saves up to 30% across all tiers. A 30-day money-back guarantee applies to all paid plans. The free plan is permanent, not a trial, and includes advanced charting, market and macro dashboards, 2 watchlists, and 2 screens.
Bottom Line
Koyfin is the right tool for investors who need global market coverage and macro context as part of their research process, not as an afterthought. The screener breadth alone separates it from the North American-focused tools on this list. At $39/month for the Plus tier, it is one of the more accessible platforms for the depth it delivers.
If you are looking for alternatives to Koyfin, consider reading our guides about the best stock analysis software, top stock analysis sites, our Portfolio123 review, and Seeking Alpha explained article.
Pros
- Equity screener covers 100,000+ global securities with 5,900+ filter criteria — the largest universe on this list
- Macro data including live yields from 40 countries, global economics, currencies, and commodities in the same platform as the stock screener
- Earnings transcripts searchable by keyword going back 50 years
- Fully customizable interface: layout, themes, panels, and workspace are all adjustable
- Free plan is permanent and includes advanced charting and macro dashboards
- 30-day money-back guarantee on all paid plans
Cons
- Mutual fund data is locked behind the $209/month Advisor Core tier, unavailable to individual investors on Plus or Premium
- Trustpilot presence is minimal. 3 reviews provides no meaningful signal on community satisfaction before subscribing.
- The advisor-tier pricing ($209/$299/month) is a significant step up from the individual investor tiers. The gap between Premium ($79) and Advisor Core ($209) is wide for features that some individual investors may want, such as mutual fund screening.
Frequently Asked Questions
How much does Koyfin cost?
Koyfin has a permanent free plan, then Plus at $39 per month, Premium at $79 per month, and advisor tiers at $209 for Advisor Core and $299 for Advisor Pro. Annual billing saves up to 30%, and a 30-day money-back guarantee applies to paid plans. For an individual investor, the Plus plan is where the core value unlocks.
Is Koyfin free?
Yes, the free plan is permanent and genuinely functional rather than a stripped-down trial, including advanced charting, market and macro dashboards, 2 watchlists, 2 screens, and 2 years of financial history. The full screener, 10 years of financials, company snapshots, filings, and transcripts require the Plus plan at $39 per month. The free tier is a legitimate starting point.
Is Koyfin worth it?
For investors who research global markets and want macro context alongside equity screening, the Plus plan at $39 per month delivers a 100,000-security screener, more than 5,900 filters, 10 years of financials, and earnings transcripts going back 50 years. The screener breadth and macro data, including live yields from 40 countries, separate it from North-America-only tools. Investors focused only on US stocks with no macro interest may find a cheaper, US-focused tool a better fit.
How does Koyfin compare to Bloomberg?
Koyfin covers global equities, macro data, transcripts, filings, and a 100,000-security screener for $468 per year on the Plus plan, against roughly $24,000 per year for a Bloomberg Terminal. Bloomberg adds fixed-income trading, a proprietary news terminal, chat, and institutional workflow tools that individual investors rarely need. For self-directed investors and smaller advisory firms, Koyfin delivers the research functionality at a fraction of the cost.