
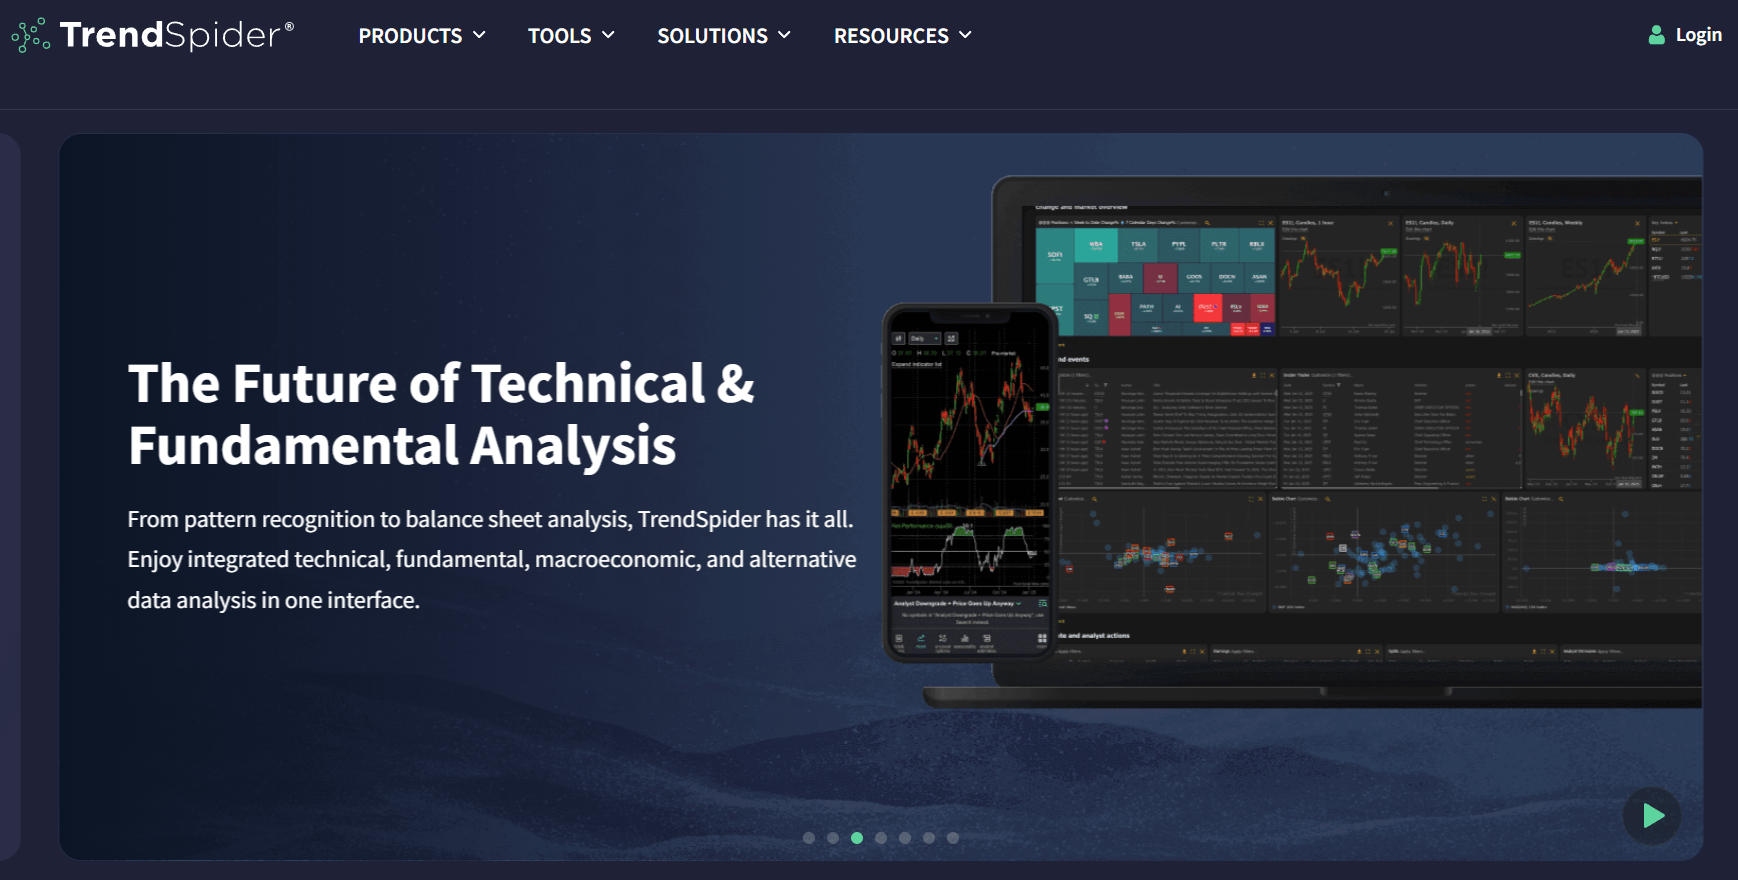
Most stock screeners find you the trade. TrendSpider goes further: it charts it, backtests the setup, alerts you when conditions are met, and automates the response. This TrendSpider review breaks down whether that full-stack approach is worth the price for active traders.
Active traders who spend time manually drawing trendlines, hunting for setups across timeframes, and managing watchlists will find real efficiency here. Those looking for a basic charting tool at low cost will find it overpowered and overpriced.
The core workflow is research, chart, scan, backtest, alert, and automate. Every feature serves one of those six steps.
Transparency: We may get compensated when you click on links in this article.
About TrendSpider
TrendSpider LLC was founded in 2016 and is registered in Chicago, IL (BBB accredited, A rating). The platform covers U.S. equities, ETFs, options, futures, forex, and crypto. Data comes from NYSE, NASDAQ, AMEX, OPRA, CBOE, CME Group, and ICE, among others. Over 20,000 traders use the platform. Trustpilot rates it 4.8/5 (verify current review count at trustpilot.com/review/www.trendspider.com), and Capterra and Google Reviews both show 4.6/5.
Phone support is listed at (833) 587-3637. A full contact page including physical address is available at trendspider.com/contacts.
The platform is browser-based and available on Android, iOS, and as a Chrome Extension that lets traders pop up a live chart directly from any webpage where a ticker symbol appears. It is designed and tested for Chrome and Firefox.
Features
Charts and Charting Tools
TrendSpider’s charting is the foundation. Line charts, bar charts, candlestick charts, Raindrop charts, and Heikin Ashi are all available. The indicator library runs to 400+ pre-built technical indicators spanning trend, momentum, volume, volatility, and market breadth. Automated trendlines, Fibonacci retracements, and support and resistance zones are plotted by the platform automatically, and they update as price moves. This is the core pitch: objective, repeatable analysis without drawing everything by hand.
Candlestick pattern recognition covers 40+ formations detected with mathematical precision. A Doji will always be flagged as a Doji. Multi-timeframe analysis lets traders overlay indicators, trendlines, and candlestick patterns from a higher timeframe directly onto a lower-timeframe chart. The example from the FAQ makes the point clearly: plot the daily 5-period simple moving average on a 15-minute chart, or detect weekly hammer patterns on a daily chart, without flipping between windows.

The Multi Symbol view supports up to 16 charts on one screen, each with its own symbol, timeframe, chart type, and indicators. Swing traders can monitor 16 positions at once. Day traders can set up intraday timeframes side by side. It was the most-requested feature for years before it shipped in 2022, which says something about the gaps that existed before it.

Raindrop Charts
Raindrop charts replace the standard OHLC view with a volume-profile-integrated visualization. Instead of just showing the direction of price during a period, Raindrops show where volume was concentrated within that period using a VWAP-based shape. A strong green candle and a Raindrop of the same period often tell different stories about conviction. The Raindrop is a genuine innovation, not a cosmetic one.
Custom Indicators via AI
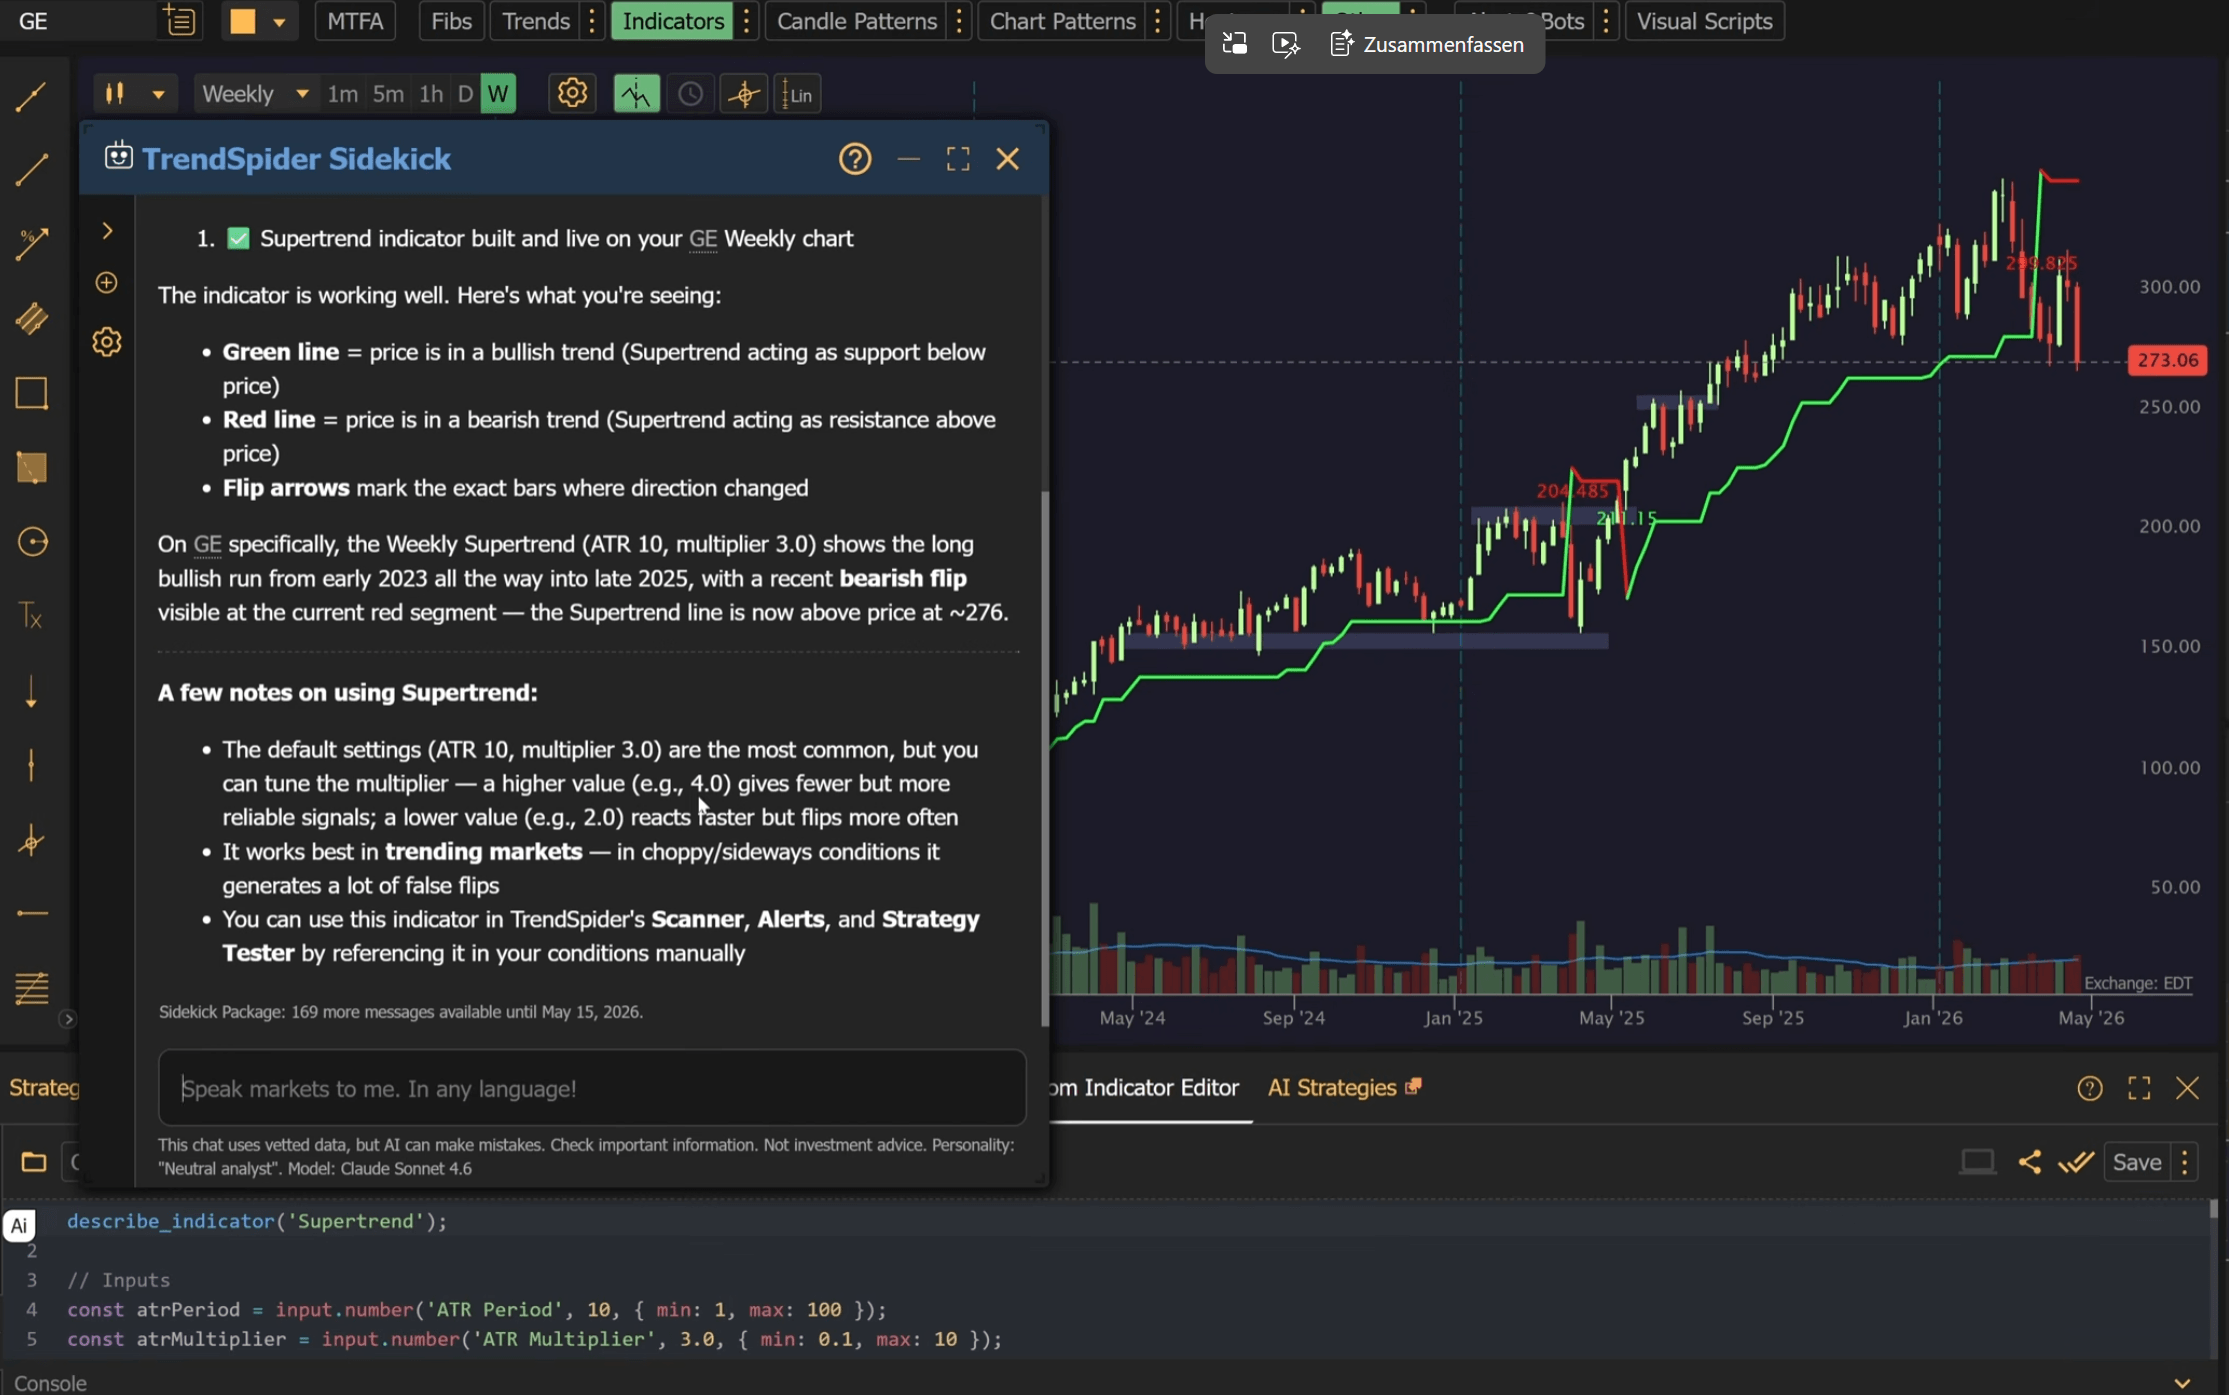
For traders who need something outside the standard indicator library, TrendSpider’s AI Coding Assistant will generate a custom indicator in JavaScript from a plain-English description. Describe the logic, and the assistant writes the code and plots it. The April 2026 update added Sidekick Agentic Coding, which goes further: rather than generating code in a single pass, it plans indicator development across multiple steps, executes each one, evaluates the rendered output, and debugs before proceeding. The result is significantly more reliable for complex trading-specific builds than a one-pass code generator.
Custom indicators can also be found in the TrendSpider Marketplace, where other users publish their own scanners, strategies, and tools.
Sidekick AI
Sidekick is TrendSpider’s AI trading assistant and one of the more substantive AI integrations in any trading platform. It is powered by frontier large language models, with Claude Sonnet as the default on all plans. Access to Google Gemini and OpenAI ChatGPT requires a paid Sidekick add-on.
Sidekick operates across multiple selectable Personalities, each with a distinct analytical style: options include a long-term value-focused mode, a neutral analyst, a quant-oriented numbers-first mode, a skeptical contrarian, and others. The Personality setting changes how Sidekick frames answers and what it prioritizes, not what data it can access. All Personalities work from the same underlying market data.
What distinguishes Sidekick from a generic chatbot is access. It can see the open chart, including price action, indicators, drawings, and timeframe, and analyze it in context. Ask “what direction does this setup favor, and where are the risk levels?” and Sidekick works from the actual chart data rather than producing a generic answer.
The full capability set: chart analysis and annotation, watchlist creation and management (including color-tagging), market scanning from plain-English prompts, custom JavaScript indicator generation and debugging, alert creation across individual symbols or entire watchlists, and multi-stock research via Deep Research mode. Deep Research, launched in March 2026, runs parallel sub-chats, one per symbol, so each gets full data access rather than sharing context across a growing list of tickers. Each sub-chat costs one Sidekick message.
An example Sidekick prompt from TrendSpider’s own documentation: “Scan the NYSE Composite for stocks breaking out of an ascending triangle pattern with bullish unusual options activity.” Sidekick translates that into scan conditions, runs it, and iterates on the results. No rule-building required.
All plans include 25 free Sidekick messages per month. Model access beyond the default (Claude Sonnet) is tied to the Sidekick add-on plan, not the base platform tier. The free allocation gives Claude Sonnet only. The $49/month Basic add-on (up to 100 messages) unlocks Google Gemini. The $129/month Plus add-on (up to 300 messages) and $349/month Max add-on (up to 1,000 messages) both include Claude Sonnet, Google Gemini, and OpenAI ChatGPT.
Market Scanner and Watchlists
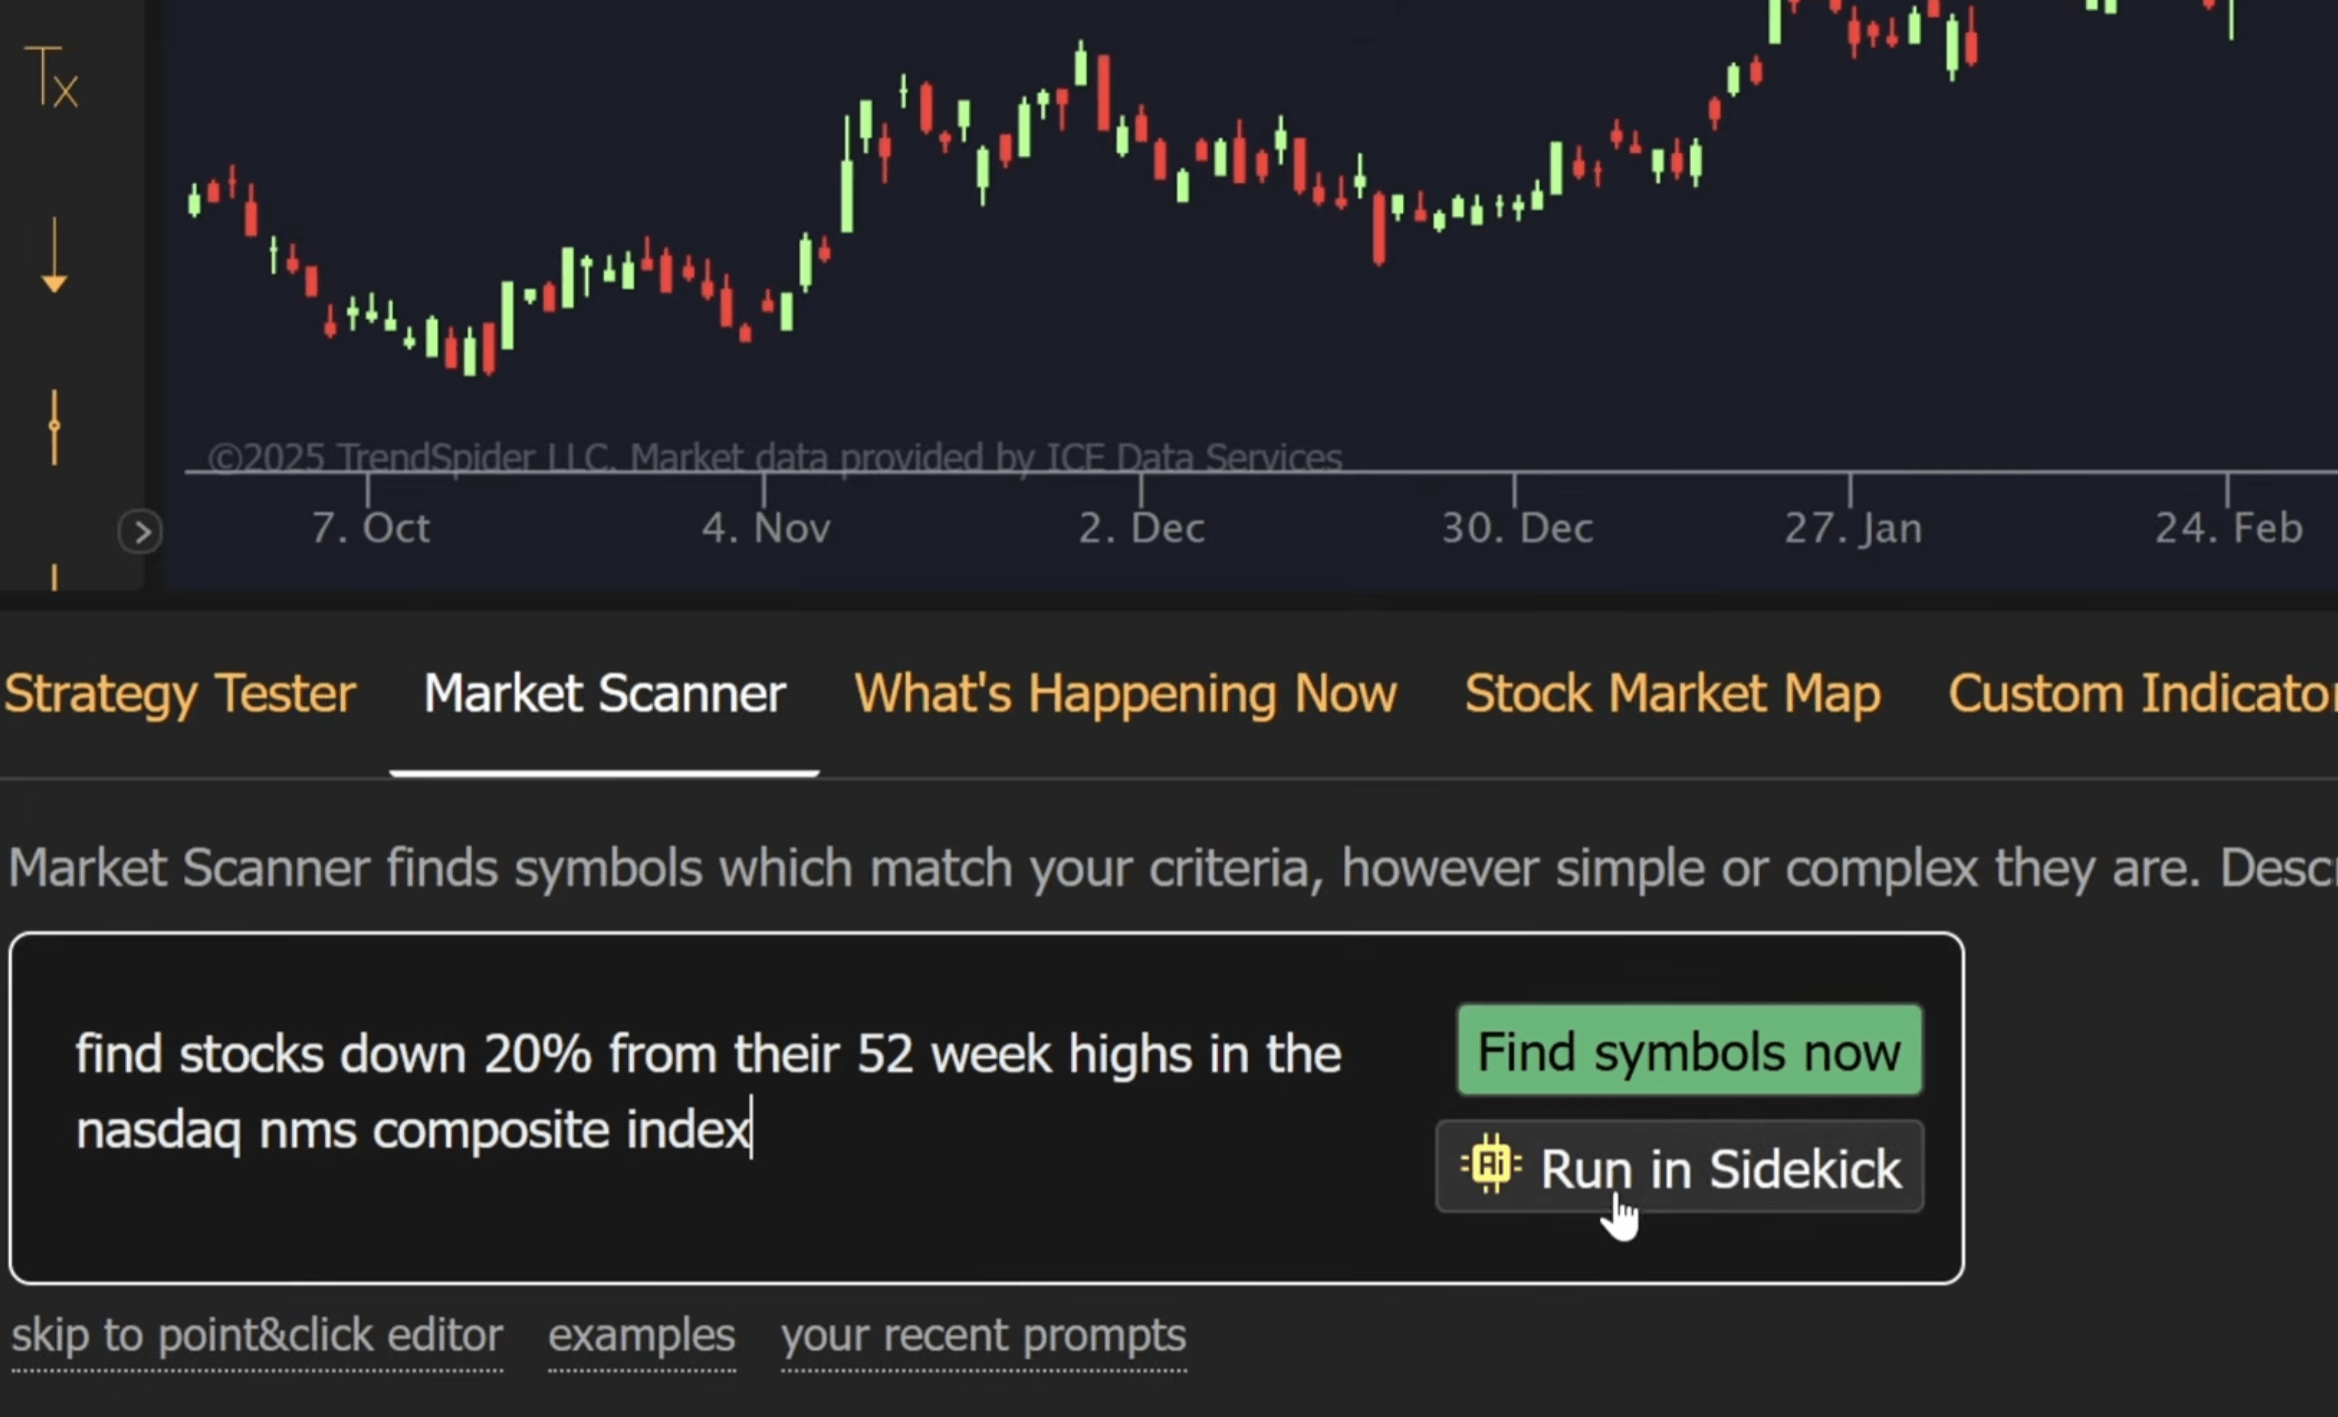
The Market Scanner runs technical, fundamental, and alternative-data conditions across the full supported universe and returns matching symbols in real time. Conditions can be combined: a breakout pattern plus a volume spike plus a positive analyst revision in a single scan. Scanners can be limited to a specific watchlist or run market-wide.
Plain-English input is built into the scanner directly. Type what you want; the platform converts it into scan conditions. For more open-ended searches, Sidekick handles the translation and iteration, including a pattern-similarity mode: ask it to “find more charts like the one I have open” and it identifies symbols matching the same setup, without requiring a single condition to be built manually.
Custom heat maps can be generated from any combination of technical and fundamental data, applied against any watchlist or scanner output. These are distinct from the support/resistance heatmap in the charting tools. The idea-generation heat maps give a visual, high-level read of market-wide conditions before drilling into individual symbols.
Scheduled Scanners run on a timer and deliver results by email. Morning setups can arrive before the session opens without the platform being open.
Smart Watch Lists are dynamic. The symbols inside update automatically as market conditions change, based on criteria including sector, industry, market cap, ETF holdings, 13F holdings, Wall Street Bets mentions, halts, and 52-week highs and lows. TrendSpider includes over 700 pre-built Smart Watch Lists out of the box. Creating custom ones from any scan output is straightforward.
Multi-timeframe scan logic is supported, so a scan can return only symbols that meet conditions on both a short-term and a longer-term timeframe simultaneously. For alternative-data signals (unusual options flow, insider transactions, dark pool activity), TrendSpider’s “What’s Happening Now” panel provides a real-time monitoring feed, separate from the scanner’s technical-plus-fundamental stack.

Backtesting: Strategy Tester, AI Strategy Lab, and Strategy Bots
These are three distinct tools that the original review conflated. They do different things.
Strategy Tester is the no-code backtesting engine. Define entry and exit conditions, take-profit and stop-loss rules, and trade cost assumptions (commission and slippage modeled as a percentage or flat dollar amount per trade) through point-and-click menus. Run the strategy on historical data going back up to 50+ years for supported symbols.
Each backtest is capped by candle count rather than calendar range, so the effective lookback depends on the timeframe selected. The Standard plan allows 2-hour minimum timeframe backtests with a 2,000-candle depth. Premium supports 5-minute timeframes with a 10,000-candle depth. Enhanced and Advanced both go to 1-minute timeframes, with 20,000 and 30,000 candle depths respectively. An add-on upgrades Standard and Premium to 20,000-candle depth for $39/month.

Performance reports include total return, Sharpe ratio, Sortino ratio, win rate, average win and loss, reward-to-risk, maximum drawdown, and a trade-by-trade log with equity curve. The KPI table is customizable, with green/no-go flags that surface issues like low trade count or extreme drawdown at a glance.
The Price Behavior Explorer lets traders step through each individual trade in the backtest to see exactly what happened around every signal, which makes it possible to understand not just whether a strategy works in aggregate, but where and why it breaks down. Variance Testing runs the same strategy across multiple symbols and timeframes simultaneously, returning scatter-plot comparisons that show how robust the edge actually is across different conditions.
A cross-symbol condition filter is also supported: a strategy on NVDA can require SPY to be above its 50-day moving average as an entry condition, enforcing a market-regime filter without building a separate scan.
AI Strategy Lab trains custom machine learning models that generate trading signals. Choose a prediction target (will this stock close higher over the next N bars?), define input features from TrendSpider’s data layer, and select a model type.
Available model types include Random Forest, K-Nearest Neighbors, Naive Bayes, and Logistic Regression. Inputs can draw on any data available in the platform: indicators, fundamentals, price action, custom formulas, and alternative data. No coding or machine learning background is required. The built-in LLM prompt box can suggest and configure features. Cross-breeding, an advanced feature, combines multiple trained models and retrains the result to reduce bias.
Once deployed, a trained model’s signals appear directly on the chart as entry markers, updating in real time alongside any other indicator, so the output integrates into the existing charting workflow rather than sitting in a separate analysis layer.
Strategy Bots (renamed from Trading Bots in March 2026) deploy a backtested strategy forward as a live automation. The bot is position-aware: it tracks whether the account is long, short, or flat, and manages the full trade lifecycle rather than firing isolated alerts. Delivery options include webhook, SMS, email, Discord, Telegram, Slack, or direct order routing through a supported broker integration via SignalStack.
Alerts and Automation
Dynamic alerts attach to trendlines, indicators, or price levels on the chart. Right-click a level, configure a trigger, buffer zone, sensitivity, and time period. Multi-factor alerts combine several conditions into one trigger, so the alert only fires when all conditions are met simultaneously.
Alert delivery: SMS, email, push notifications, in-app, or webhook to any service that accepts an HTTP POST. Alerts run on TrendSpider’s cloud, so they fire even when the browser is closed.
Alert limits by plan: Standard gets 10 active alerts with a 30-day duration. Premium gets 50 alerts at 90 days. Enhanced gets 100 alerts at 180 days. Advanced gets 400 alerts at 365 days.
Strategy Bots are capped at 5 per account on Standard, 10 on Premium, 50 on Enhanced, and 100 on Advanced.
Broker connectivity is handled through the Trading Widget, which connects to 30+ brokerages and crypto exchanges. SignalStack, included free with any TrendSpider subscription for manual trading, handles webhook-based order routing. Automated trades via webhooks come with 5 free per month; additional capacity requires upgrading the SignalStack account separately.
Options Flow
The Options Flow feature has been live since 2022. The original review described it as “brand new” and that description has been removed.
The scanner tracks large directional options trades including block trades and sweeps. The tool surfaces the relevant details for each trade: size, expiration date, strike price, and premium. The unusual options scatterplot chart visualizes current options trading activity across the market and makes anomalous prints easier to identify.
TrendSpider includes these unusual options flow and visualization tools as part of its alternative data layer, alongside charts, scans, alerts, and other market data. As of March 2026, real-time options data from OPRA and CBOE is integrated across charting, watchlists, scanning, backtesting, alerts, and symbol search, available for $9.50/month for non-professional users.
Other Features
The alternative data layer is wide. Insider trade data, FINRA Reg SHO short-volume data, dark pool and ATS volume, market breadth indicators, Federal Reserve (FRED) economic series, Congressional trading disclosures, Benzinga Pro news, and social sentiment from StockTwits and WallStreetBets are all accessible within the platform. Corporate fundamentals cover 240+ metrics pulled directly from SEC filings (EPS, revenue, EBITDA, share counts, SG&A, P/E, forward P/E, and more) for any U.S.-listed company. Earnings, dividends, and analyst estimates are included alongside technicals.
Analyst recommendation data can be used like a technical indicator: overlay Wall Street ratings on a price chart, correlate them with subsequent price action, and backtest analyst recommendations directly in the Strategy Tester. This makes it possible to identify which analysts have a track record worth following and which do not, rather than treating all consensus ratings as equally valid.
The heatmap color-codes support and resistance levels using historical order book data. Sensitivity control lets traders define how close price needs to approach a level before an alert fires, which reduces noise on levels that are approached but rarely broken.
Smart Checklists let traders define a multi-condition list that runs automatically every time a chart loads, returning a simple green/red result for each condition. The use case is straightforward: traders who follow a pre-trade checklist manually can encode that checklist once and have it run against every chart automatically, without the risk of skipping a step under pressure.
Seasonality analysis tracks how an asset tends to behave by hour, day, week, and month, with outlier filtering to improve signal quality. It is not a trading signal on its own, but it adds useful context to timing decisions and works directly on charts alongside technical data.
Plans and Pricing
TrendSpider currently offers four individual plans: Standard, Premium, Enhanced, and Advanced. All plans include access to all features. The differences are in usage limits.
| Plan | Alerts | Strategy Bots | Scan Min. TF | Backtest Depth | Price (introductory, billed yearly) |
|---|---|---|---|---|---|
| Standard | 10 | 5 | 2-hour | 2,000 candles | ~$52/mo |
| Premium | 50 | 10 | 5-minute | 10,000 candles | ~$66/mo |
| Enhanced | 100 | 50 | 1-minute | 20,000 candles | ~$88/mo |
| Advanced | 400 | 100 | 1-minute | 30,000 candles | ~$154/mo |
All plans include 25 free Sidekick messages per month and at least 1 free training session per year (up to 52 per year on Advanced). Standard and Premium come with standard support via email and chat. Enhanced and Advanced include priority support with phone and Zoom access.
The prices shown are introductory rates for new customers on the first billing period only (first 12 months on annual, first 3 months on quarterly, first month on monthly). Standard pricing applies after that initial term. Monthly billing is available at higher rates. Check trendspider.com/pricing for current and ongoing pricing.
Add-ons available separately: upgraded backtest depth to 20,000 candles for Standard and Premium at $39/month, 10 extra scheduled scans for any plan at $14/month, real-time futures data at $7.50/month (non-professional), options data at $9.50/month (non-professional). A Business plan for multi-user teams starts from $399/month.
Trial
TrendSpider no longer offers a free trial. A paid 14-day trial is available on all four plans. Trial pricing varies by plan and may also vary based on account status, existing cookies, or whether the visitor is logged in. Check trendspider.com/pricing for the current trial offer. Trial fees are non-refundable, but if a full plan is purchased and cancelled within 72 hours, a refund (minus the trial fee) can be requested.
Coupon Code
A 30% discount is available with promo code TTF30 on all plans and billing cycles.
Bottom Line
TrendSpider has grown well past its original identity as a charting tool with automated trendlines. The platform now spans research, charting, scanning, backtesting, AI model training, alert management, and order routing. Most of those capabilities are genuinely deep, not surface-level.
The Standard plan’s limitations are real. A 2-hour minimum backtest timeframe and a 2,000-candle depth cap are restrictive for serious strategy testing. Active intraday traders will need Premium at minimum, and those running multiple Strategy Bots will need Enhanced. The Sidekick message cap of 25 per month on all base plans runs out fast for anyone who relies on it heavily.
What TrendSpider does better than most competitors: automation without code. Building a scan, backtesting a strategy, deploying it as a bot, and connecting it to a broker can be done entirely through point-and-click or plain-English prompts. That workflow is genuinely uncommon at this price point.
Looking for a stock screener for day trading? Take a look at our Trade Ideas review.
Pros
- 400+ indicators, automated trendlines, Fibonacci, and candlestick recognition out of the box
- Strategy Tester, AI Strategy Lab, and Strategy Bots covering no-code backtesting, ML model training, and live deployment
- Sidekick AI with chart vision, scan building, alert creation, and Deep Research across multiple symbols
- 700+ Smart Watch Lists plus natural-language and scheduled scanners
- Real-time options data integrated across charting, scanning, and backtesting
- Broker connectivity to 30+ brokerages via SignalStack
Cons
- Standard plan backtest is limited to 2-hour minimum timeframes and 2,000 candles, which makes strategy testing on intraday data impractical at the entry tier
- 25 Sidekick messages per month on all base plans is not enough for heavy AI usage without a paid Sidekick add-on
- Options data, futures data, and upgraded backtest depth each cost extra on top of the subscription fee
- No free trial; paid trial fees are non-refundable
Frequently Asked Questions
What is TrendSpider?
TrendSpider is a browser-based technical analysis platform founded in 2016 and registered in Chicago, covering US equities, ETFs, options, futures, forex, and crypto. Its core workflow spans research, charting, scanning, backtesting, alerts, and automation, built so a trader can build a scan, test a strategy, deploy it as a bot, and route it to a broker without writing code. Features include over 400 indicators, automated trendlines and Fibonacci levels, more than 40 candlestick patterns, and a Sidekick AI assistant.
How much does TrendSpider cost?
TrendSpider offers four individual plans that all include every feature and differ only by usage limits: Standard at about $52 a month, Premium at about $66, Enhanced at about $88, and Advanced at about $154, at introductory rates billed yearly for the first term. Higher tiers raise alert counts, Strategy Bot limits, and backtesting depth. Real-time options data at $9.50 a month for non-professionals, futures data at $7.50, and upgraded backtest depth at $39 are paid add-ons on top of the subscription.
Does TrendSpider offer a free trial?
No. The free trial was discontinued and replaced by a paid 14-day trial available on all four plans at a fee that varies by tier. Trial fees are non-refundable, though if a trader buys a full plan and cancels within 72 hours, a refund minus the trial fee can be requested. The platform also includes 25 free Sidekick AI messages per month on every plan.
What is Sidekick AI in TrendSpider?
Sidekick is TrendSpider’s built-in AI trading assistant, powered by Claude Sonnet as the default on all plans, with Google Gemini and OpenAI ChatGPT available through paid add-ons. It can read the open chart in context, build market scans from plain-English prompts, create alerts across watchlists, write and debug custom JavaScript indicators, and run parallel multi-stock research. Every plan includes 25 free Sidekick messages per month, with paid add-ons raising the cap and unlocking the additional models.