
Finding the right stock charting software transforms how you analyze the financial markets. I’ve tested these platforms with real money, and the differences genuinely matter.
Transparency: We may get compensated when you click on links in this article.
Quick Comparison: Best Charting Software at a Glance
| Platform | Best For | Starting Price | Global Markets | AI Features |
|---|---|---|---|---|
| TradingView | Community & Flexibility | Free (Pro at $14.95/mo) | Stocks, forex, crypto, futures | Limited |
| TrendSpider | Technical Analysis | $49.95/month | Stocks, crypto, currencies | Yes |
| Trade Ideas | Day Trading & Scanning | $84/month | US stocks, global markets | Advanced AI |
| Finviz | Quick Market Scanning | Free (Elite at $39.95/mo) | US stocks, stock exchanges | No |
| Koyfin | Fundamental Research | Free (Pro at $39/mo) | Stocks, mutual funds, commodities | Basic |
What Makes the Best Charting Software?
After analyzing trends across charting platforms, a few things separate good charting tools from the best charting software:
Essential charting capabilities:
- Global markets access (stocks, forex, futures, commodities, currencies)
- Technical indicators to analyze trends and market movements
- Historical data for backtesting trading strategies
- Real time data for intraday charts and price action
- Drawing tools for chart patterns
- Customizable charts for your investing style
The platforms below excel in different areas, whether you need advanced charting tools or the best free charting software.
1. TradingView: Best Overall Charting Platform
Overview and Pricing
Price: Free / Pro starts at $14.95/month

TradingView dominates the charting software space. When I ask traders what charting platform they use, TradingView comes up nine times out of ten.
Global Market Coverage
The platform gives traders access to stocks across multiple stock exchanges, forex, cryptocurrencies, futures, and commodities. This global market coverage beats competitors who focus solely on US markets or charge extra for international data.
Advanced Charting Tools
TradingView’s charting capabilities are genuinely impressive. Over 100 built-in technical indicators, extensive drawing tools, and Pine Script for creating custom studies. I spent a weekend learning Pine Script basics and built indicators that match my trading strategies perfectly.
Real-World Usage
I use TradingView for swing trades across global markets. The multi-timeframe analysis lets me view daily, 4-hour, and 1-hour charts simultaneously. The alert system sends notifications when stocks hit key levels, essential for tracking market movements.
The community aspect helps me trade smarter. The “Editor’s Picks” section features technical analysis from experienced traders sharing chart patterns and insights.
Pros and Cons
Pros:
- Massive library of technical indicators and analysis tools
- Works on web, desktop, and mobile
- Strong community sharing trading tools and strategies
- Affordable free plan with upgrade options
- Covers global markets including forex and futures
Cons:
- Free version has ads and limited real time charts
- Real time data requires paid subscription
- Can overwhelm beginners learning technical analysis
- Some advanced features locked behind premium tiers
Who Should Use TradingView?
If you want a flexible charting platform that grows with you, TradingView is hard to beat. It’s especially good for swing traders and long term investors who don’t need millisecond-level market data.
Our comprehensive TradingView review covers all pricing plans, Pine Script capabilities, and how to maximize the community features for finding trade setups.
2. TrendSpider: Best for Automated Technical Analysis Tools
Overview and Pricing
Price: $49.95/month (Essential plan)

TrendSpider feels like having a technical analyst working 24/7. The automated trendline detection saved me hours during earnings season.
Pattern Recognition and Chart Patterns
The AI-powered pattern recognition actually works. I was skeptical at first, but TrendSpider genuinely identifies chart patterns like head and shoulders, flags, and triangles with impressive accuracy.
Multi-Timeframe Analysis
TrendSpider shines with multi-timeframe analysis. You can view up to 8 timeframes simultaneously with automated analysis. When looking for confluence to analyze trends, this feature is invaluable for trading strategies.
Real-World Application
I use TrendSpider for technical stock analysis. The automated trendlines update as candles form, eliminating constant manual adjustments. The backtesting feature lets me test strategies before risking capital.
Dynamic Price Alerts trigger based on technical conditions like “alert when RSI crosses above 30 AND price breaks above the 50-day MA.” This specificity catches good entries.
Pros and Cons
Pros:
- Automated trendline and pattern recognition
- Excellent multi-timeframe technical analysis tools
- Built-in backtesting capabilities
- Raindrop Charts (unique visualization)
- Strong technical indicators suite
Cons:
- Steeper learning curve than simpler platforms
- More expensive than basic charting software
- UI can feel cluttered with advanced features
- Primarily stocks and crypto (limited forex coverage)
Best For Active Traders
Technical traders who want automation and sophisticated pattern recognition will appreciate TrendSpider. If you’re manually drawing trendlines for hours, this charting platform pays for itself quickly.
For a detailed breakdown of TrendSpider’s pricing tiers, AI strategy lab features, and how the multi-timeframe analysis works in practice, check our TrendSpider review.
3. Trade Ideas: Best for Day Trading and Market Scanning
Overview and Pricing
Price: Starting at $84/month (Standard plan)

Trade Ideas is what I open first every morning. It’s expensive, but for retail trading and active traders, the real-time scanning is unmatched.
Holly AI and Trading Bots
Holly AI is the standout feature. This artificial intelligence generates trade ideas based on historical data and current market movements. Holly has pointed me toward profitable setups I’d have missed with manual market scanning.
The real-time scanning is blazingly fast. You can create scans with dozens of criteria, and Trade Ideas alerts you instantly when stocks meet your conditions. During the first trading hour when I’m hunting momentum plays, this speed matters.
Real-World Trading Workflow
My morning routine: Open Trade Ideas at 8:45 AM EST, check Holly’s top picks, run custom scans for gap-ups. By 9:30 market open, I have 5-10 focused stocks ready.
OddsMaker shows historical win rates for specific setups. If a stock gaps up 5% on earnings with high volume, it reveals how often that pattern led to gains. It adds data-driven perspective to trading strategies.
Pros and Cons
Pros:
- Fastest real-time market scanning in the industry
- Holly AI generates unique trading strategies
- Excellent for pre-market and after-hours analysis
- OddsMaker provides historical pattern data
- Cloud-based (no installation needed)
Cons:
- Expensive compared to free charting software options
- Overwhelming for new day traders
- Basic charting (most traders pair with TradingView)
- Requires real time data package at additional cost
Perfect for Day Traders
Day traders who need lightning-fast market scanning and AI-assisted idea generation will find Trade Ideas worth the investment. If you’re trading 3+ times weekly and hunting short-term setups, it justifies the cost.
Our Trade Ideas review breaks down all pricing tiers, Holly AI strategies, and shows you how to build profitable scans.
4. Finviz: Best Free Charting Software
Overview and Pricing
Price: Free / Elite at $39.95/month

Finviz is what I recommend to beginners, and it remains in my daily rotation. The free version offers surprising functionality, the best free charting software for getting started.
Speed and Market Scanning
Speed and simplicity define Finviz. It’s fast in loading times and how quickly you scan financial markets. The homepage gives instant market overview with heat maps, sector performance, and trending stocks. I get a complete picture in under 30 seconds.
The stock screener is legendary among traders. You can filter by valuation metrics, technical indicators, and descriptive criteria (like “dividend yield over 3%”). Results display as sortable tables or visual grids with mini-charts. For quick market scanning, this beats every other platform.
Real-World Application
I use Finviz for two things: quick morning market overview and finding new trade ideas. The “Top Gainers,” “Top Losers,” and “Most Volatile” lists show where the action is. The heat map reveals sector rotation and market movements at a glance.
For swing setups, I run pre-built screens like “Oversold RSI with Price Above 200-day MA” to find potential reversals. Then I export results and do deeper analysis in TradingView.
Pros and Cons
Pros:
- Free plan genuinely useful for retail trading
- Fastest market overview and screening
- Excellent screener with descriptive filters
- Heat maps and visualizations
- No installation (web-based)
Cons:
- Basic charting with limited drawing tools
- No real time charts in free version
- No backtesting or automated trading capabilities
- Interface looks dated
- Limited to stocks (no forex, futures, commodities)
5. Koyfin: Best for Fundamental Analysis
Overview and Pricing
Price: Free / Pro at $39/month
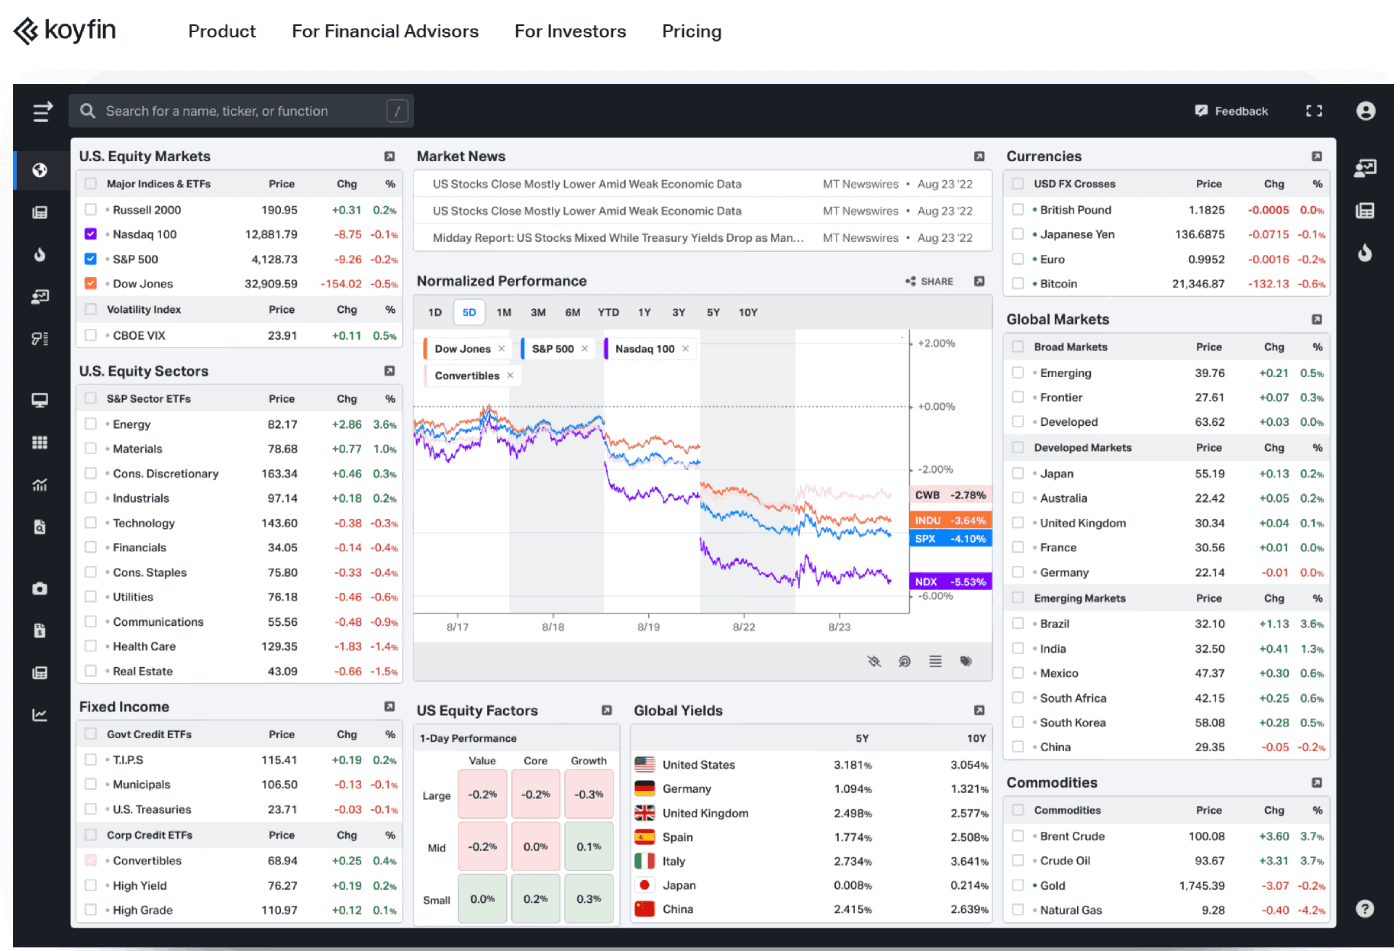
Koyfin surprised me. I initially dismissed it as “another finance platform,” but it’s become essential for fundamental analysis.
Combining Technical and Fundamental Analysis
Koyfin bridges the gap between charting tools and fundamental research better than any platform I’ve tested. You can view technical indicators and fundamentals side-by-side, exactly how I evaluate long term investors’ opportunities.
The data visualization is exceptional. Financial statements aren’t boring tables, Koyfin presents them as interactive dynamic charts where you can instantly compare metrics across competitors. When researching semiconductor stocks, I overlaid revenue growth, margins, and P/E ratios for 10 companies in seconds.
Real-World Usage
I use Koyfin for swing trades and investment research. The screener filters by both fundamental and technical criteria (like “P/E under 15 AND price above 200-day MA”). This combination helps find undervalued stocks with positive momentum.
The news aggregation covers global markets effectively. Instead of browsing multiple sites, I get relevant news filtered by stocks and sectors I’m watching. During earnings season, this saves considerable time.
Coverage Across Asset Classes
Koyfin covers stocks, mutual funds, US mutual funds, and various commodities. For active investors who research fundamentals before entering positions, this breadth of market data matters.
Pros and Cons
Pros:
- Excellent fundamental data visualization
- Combines technical analysis tools with fundamentals
- Strong screener with diverse criteria
- Clean, modern interface
- Generous free plan
Cons:
- Limited technical indicators versus TradingView
- Real time data requires Pro subscription
- No mobile app (mobile web works but isn’t optimal)
- Smaller community than TradingView
Best Free Alternative
Anyone wanting free charting software for market scanning and stock screening should start with Finviz. It’s perfect for generating trade ideas you then analyze more deeply elsewhere.
Learn how to use Finviz Elite’s pre-market scans, build custom filters, and maximize the heat map visualizations in our Finviz Elite review.
How to Choose Your Charting Platform
After testing these platforms, here’s who should use what based on investing style and trading strategies.
For Beginners: Start with free charting software, Finviz for screening and TradingView for charts. Learn basics without spending money.
For Day Traders: Trade Ideas for market scanning plus TradingView for execution. Yes, it’s expensive ($100+/month), but the time saved justifies the cost for active traders.
For Swing Traders: TradingView Pro ($14.95/month) covers 90% of needs. Add Koyfin ($39/month) if your strategies incorporate fundamentals.
For Technical Analysis: TrendSpider ($49.95/month) saves hours on manual analysis. The automated pattern recognition pays for itself.
For Long Term Investors: Koyfin free or Pro provides fundamental analysis tools across stocks, mutual funds, and commodities without day trading clutter.
What I Actually Use Daily
Full transparency: I pay for four of these platforms. Here’s my workflow:
Morning (8:30-9:30 AM): Trade Ideas for Holly AI and market scanning, Finviz for heat maps, TradingView for technical analysis.
During Trading (9:30 AM – 4:00 PM): Trade Ideas for real time alerts, TradingView for execution.
Evening: TrendSpider for weekly chart analysis, Koyfin for fundamental research, TradingView for sharing technical analysis.
Do I need all of them? Probably not. But each excels at something specific, and as someone who takes trading seriously, these charting tools help me trade smarter.
Common Mistakes to Avoid
The biggest mistake new traders make is buying every tool immediately and feeling overwhelmed. Start simple, prove your trading strategies work, then add specialized charting tools.
Remember: no charting software makes you a better trader automatically. Focus on strategy first, tools second.
Quick Reference Guide
- Best Overall: TradingView (flexibility, community, global markets)
- Best for Day Trading: Trade Ideas (real-time scanning, Holly AI)
- Best for Technical Analysis: TrendSpider (automation, chart patterns)
- Best for Fundamentals: Koyfin (company research, data visualization)
- Best Free Option: Finviz (market scanning, quick overview)
Whatever you choose, commit to one charting platform for 3 months. Learning a platform deeply matters more than having the “perfect” tool.
FAQ: Charting Software Questions Answered
What is the best charting software?
TradingView is widely considered the best charting software for most traders. It offers comprehensive global market coverage, extensive technical indicators, a strong community, and flexible pricing. However, the “best” depends on needs, day traders might prefer Trade Ideas for scanning, while technical analysts may choose TrendSpider for automated pattern recognition.
What is a free alternative to BigCharts?
Finviz is the best free alternative to BigCharts, offering powerful market scanning, heat maps, and screening without cost. TradingView’s free plan is another excellent option with more advanced charting capabilities and technical indicators. Both provide substantial functionality without additional costs.
Is TradingView the best charting software?
TradingView is the best charting software for most traders because it balances powerful charting capabilities, global markets coverage (stocks, forex, futures, currencies, commodities), extensive technical indicators, and community features at reasonable prices. However, specialized traders may prefer alternatives, day traders often choose Trade Ideas for faster market scanning, while fundamental analysts might prefer Koyfin’s data visualization.
What platform do most traders use?
Most traders use TradingView as their primary charting platform, with over 50 million users worldwide. The combination of free and paid options, global markets coverage, strong technical analysis tools, and active community makes it the default choice. Many professionals also use Interactive Brokers for order routing alongside TradingView for charting. Day traders commonly pair Trade Ideas for scanning with TradingView for analysis.
Final Thoughts
The best stock charting software depends on your trading strategies and budget. Starting over with limited funds, I’d do this:
Month 1-3: Free Finviz and TradingView. Master charting basics.
Month 4-6: Upgrade to TradingView Pro ($14.95/month) for real time data.
Month 7+: Add specialized tools based on your style.
Whether you need portfolio tracking, global markets access, or advanced charting tools to analyze trends, there’s a platform above that fits. Start simple and expand your trading tools as your strategy develops and your understanding of market movements deepens.