
The best technical analysis software fits your trading strategies without complexity. I’ve tested every major platform, tracking how their tools help make trading decisions in real markets.
Transparency: We may get compensated when you click on links in this article.
Quick Comparison: Top Technical Analysis Software
| Platform | Best For | Price | Key Strength | Paper Trading |
|---|---|---|---|---|
| TrendSpider | Automated Analysis | $49.95/mo | Pattern recognition | Yes |
| TradingView | Community & Charts | Free-$59.95/mo | Social features | Yes |
| TC2000 | U.S. Stocks | $9.99/mo | Scanning power | No |
| Koyfin | Fundamental Focus | Free-$39/mo | Data visualization | No |
| ProRealTime | European Markets | Free-€49/mo | Professional grade | Yes |
What Makes Great Technical Analysis Software?
The best technical analysis software shares key characteristics:
Essential features:
- Multiple time frames for price action analysis
- Technical indicators like moving averages and RSI
- Drawing tools for support and resistance
- Historical data for backtesting strategies
- Real time data for active traders
- Custom indicators for personal trading systems
- Set alerts for key price levels
The platforms below excel in different areas for every investor need.
1. TrendSpider: Best for Automated Technical Analysis
Overview
Price: $49.95/month (Essential plan)

TrendSpider leads the technical analysis software space for automation. The platform uses AI to handle tedious chart work, drawing trendlines, identifying chart patterns, and analyzing multiple time frames simultaneously.
I’ve tested TrendSpider for over a year. The time it saves is substantial, 30 minutes of manual work now happens in seconds.
Pattern Recognition & Multi Timeframe Analysis
The AI-powered pattern recognition identifies chart patterns like head and shoulders, flags, and triangles across thousands of financial instruments. The multi timeframe analysis lets you view up to 8 time frames with automated technical analysis across all of them, essential for finding confluence.
TrendSpider’s automated trendlines update as new data points form. The Raindrop Charts provide unique visualization of price fluctuations.
I use TrendSpider primarily for swing trading stocks. The backtesting feature tests strategies using historical data before risking capital. Dynamic Price Alerts trigger based on complex setups.
For details on features and pricing, check our TrendSpider review.
Pros & Cons
Pros:
- Automated pattern and trendline detection
- Excellent multi timeframe analysis tools
- Built-in backtesting with years of data
- No coding required for strategies
- Strong technical indicators library
Cons:
- Steeper learning curve than basic platforms
- More expensive than free alternatives
- Primarily focused on stocks and crypto
- Limited forex coverage
Best For
Technical traders who want automation will love TrendSpider. If you’re spending hours manually analyzing charts, this trading platform pays for itself quickly. Experienced traders who understand technical analysis but want to trade smarter will find the most value.
2. TradingView: Best Trading Platform for Community
Overview
Price: Free / Pro starts at $14.95/month

TradingView dominates as the best trading platform for social features. The platform covers stocks across global exchanges, forex, futures, and cryptocurrencies, better coverage than most competitors.
Advanced Charting & Community
TradingView’s technical analysis tools include over 100 built-in technical indicators, extensive drawing tools, and Pine Script for custom indicators. The charting capabilities rival desktop platforms while running in your browser.
The community aspect helps generate trading ideas. The “Editor’s Picks” features detailed technical analysis from experienced traders. I’ve found profitable setups by seeing what retail traders watch.
I use TradingView across multiple asset classes. The alert system works on mobile devices. The paper trading feature lets new traders practice without risk.
Read our TradingView review for detailed features and pricing.
Pros & Cons
Pros:
- Massive library of technical indicators
- Works everywhere (web, mobile apps, desktop)
- Strong community sharing analysis tools
- Affordable pricing tiers
- Covers global markets including forex
Cons:
- Free version has ads and limited real time charts
- Advanced features locked behind premium tiers
- Can overwhelm beginners learning technical analysis
- Real time data requires paid subscription
Best For
If you want a flexible trading platform that grows with you, TradingView is the best choice. It’s especially good for traders who value community insights alongside their own technical analysis.
3. TC2000: Best for U.S. Stock Market
Overview
Price: $9.99/month (TC2000 Lite)
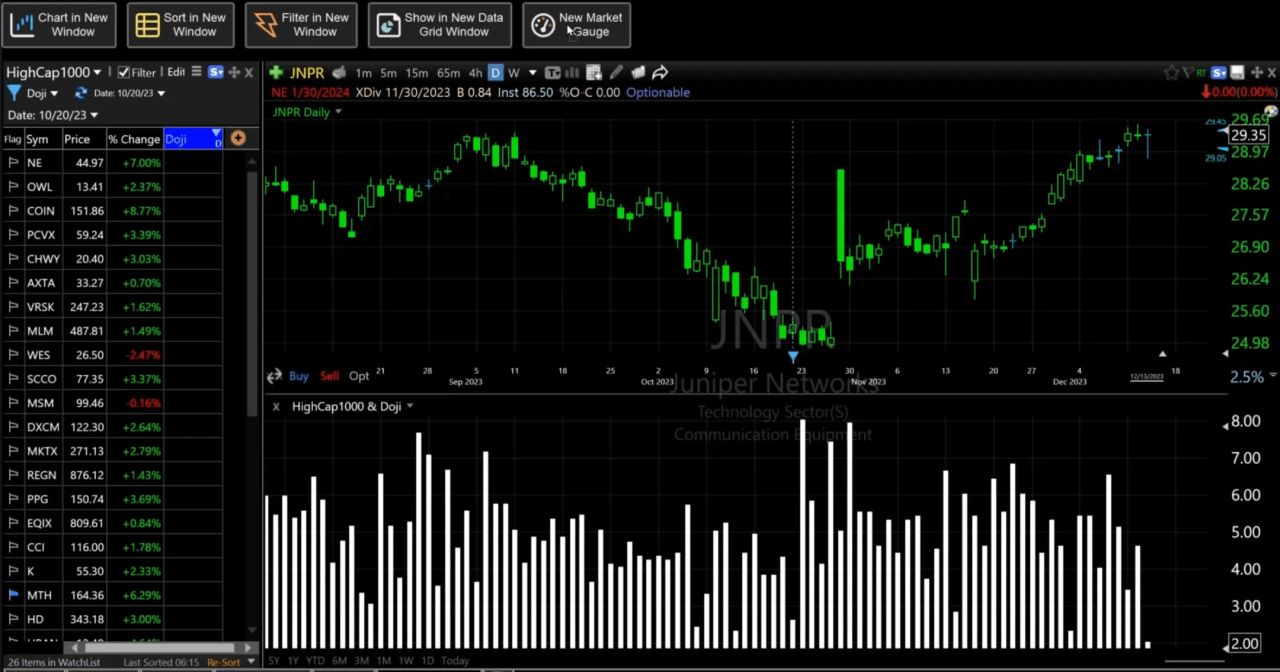
TC2000 specializes in the stock market with strong U.S. stock scanning. Worden Brothers developed this technical analysis software for American equities.
Scanning Power & Tools
The scanning capabilities are TC2000’s standout feature. You can create complex setups combining technical indicators, price action, and volume across thousands of stocks. The EasyScan includes pre-built scans for common technical analysis setups. The relative rotation graphs show sector rotation at a glance.
TC2000 includes all standard technical indicators plus unique analytical tools. Our review about TC2000 explains the details. The drawing tools let you mark support and resistance effectively. The yearly price charts give good historical perspective.
I use TC2000 for finding U.S. stock opportunities. The platform integrates with Interactive Brokers for order routing. It doesn’t offer paper trading, which limits practice opportunities.
Pros & Cons
Pros:
- Powerful scanning for U.S. stocks
- Affordable pricing starting under $10
- Fast execution of complex scans
- Good learning resources
- Clean interface focused on analysis
Cons:
- Primarily U.S. stock market only
- No paper trading feature
- Limited cryptocurrency coverage
- Less suitable for forex and futures
Best For
Traders focused exclusively on U.S. stocks who need fast scanning capabilities. If you’re looking for the best trading platform for domestic equities without paying premium prices, TC2000 delivers strong value.
4. Koyfin: Best for Combining Technical and Fundamental Analysis
Overview
Price: Free / Pro at $39/month
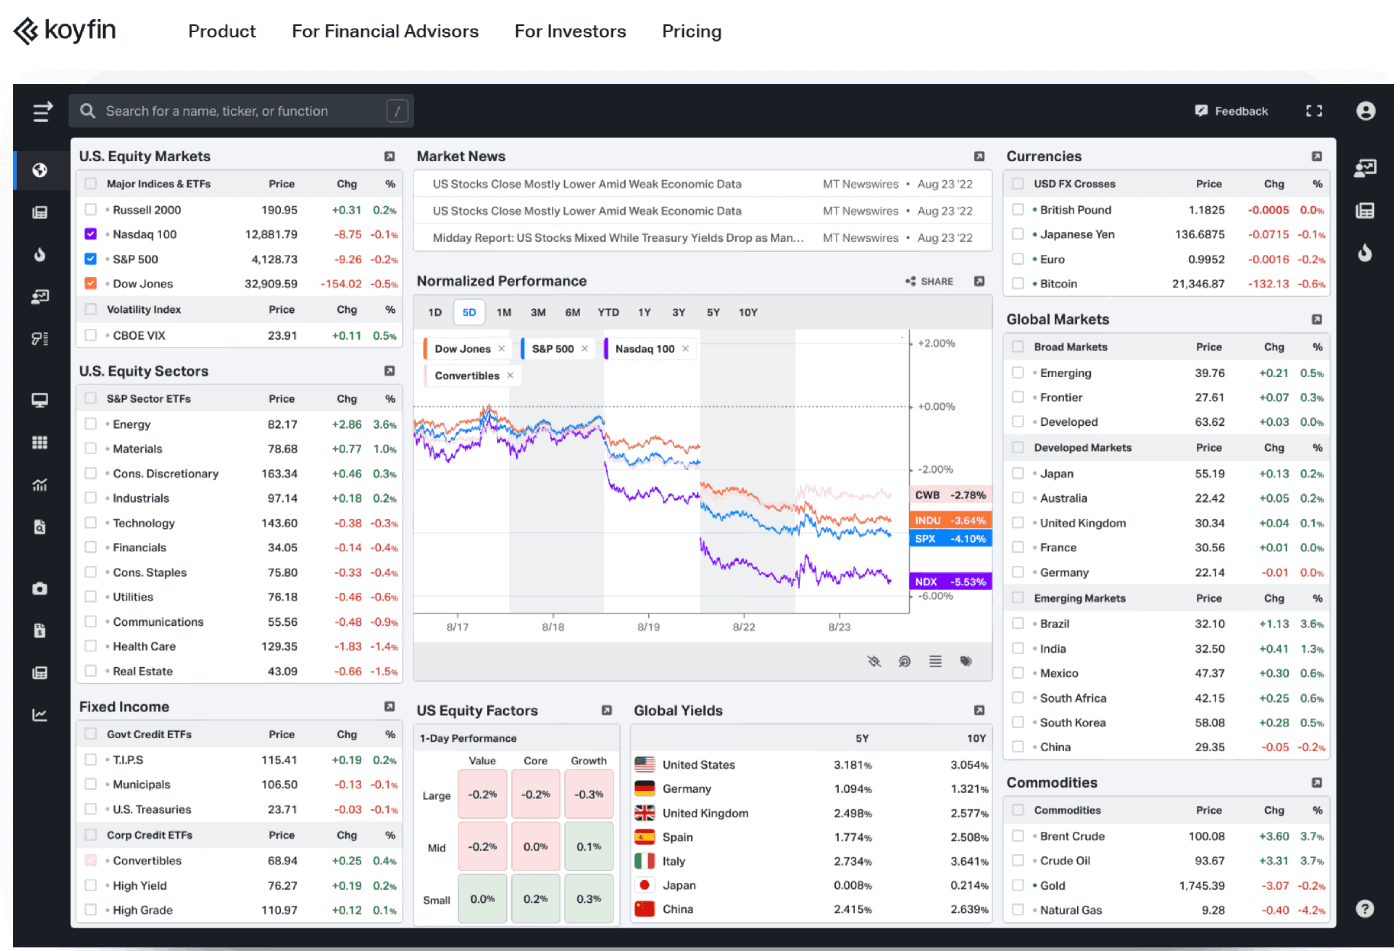
Koyfin combines technical and fundamental analysis. This trading platform bridges technical indicators and company fundamentals better than alternatives.
Data Visualization & Screening
Koyfin’s strength is presenting market data. Financial statements become interactive charts for instant comparison across companies. I can overlay technical indicators on the same screen as revenue growth and profit margins.
The platform covers stocks, ETFs, and financial instruments across global markets. The screener filters by both fundamental and technical criteria like “P/E ratio under 15 AND price above 200-day moving averages.”
I use Koyfin for longer-term trading strategies where fundamentals matter. It helps avoid high risk by incorporating company data alongside technical analysis.
Pros & Cons
Pros:
- Combines technical and fundamental analysis
- Strong data visualization
- Generous free tier
- Clean, modern interface
- Good for both investors and traders
Cons:
- Limited technical indicators compared to dedicated platforms
- No paper trading feature
- Real time data requires Pro subscription
- Smaller community than TradingView
Best For
Investors who use technical analysis alongside fundamental research. If your trading strategies incorporate company financials and market trends, Koyfin provides a unique all-in-one solution.
5. ProRealTime: Best for European Markets
Overview
Price: Free (end-of-day) / From €29.95/month for real time
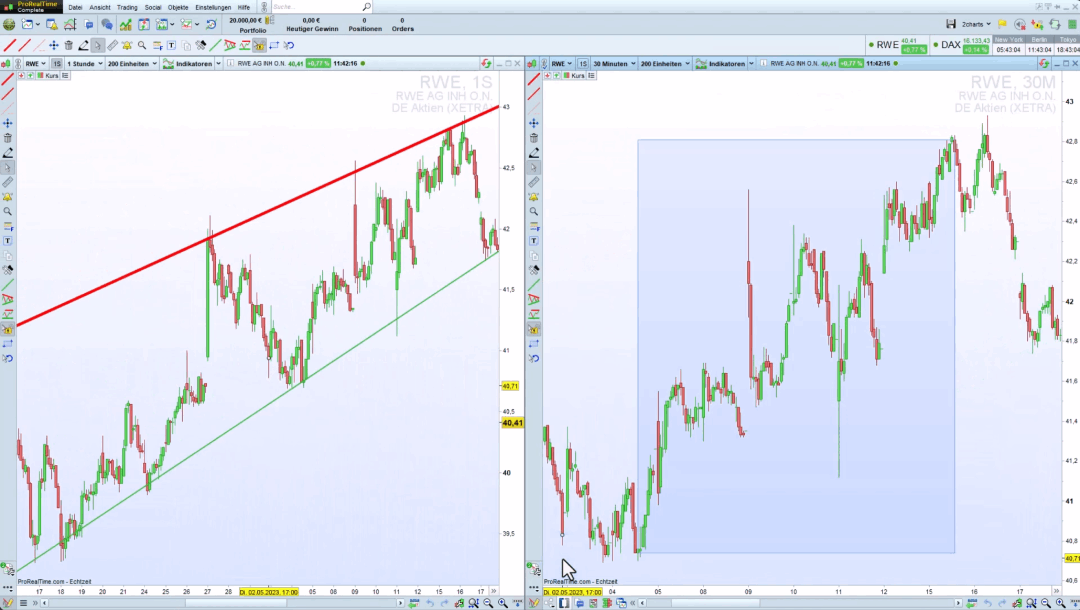
ProRealTime is French technical analysis software serving over a million users. It’s strong for European traders but works globally.
Professional Features & Customization
ProRealTime includes charts with technical indicators, drawing tools, backtesting, market replay, and automated trading. The platform processes real time data from global exchanges including stocks, forex, and futures.
The end-of-day version is free. You can customize your workspace with unlimited price charts and create intraday setups. Smart alerts notify you when technical conditions are met. The platform integrates with Interactive Brokers and other online brokers.
I tested ProRealTime for forex and found comprehensive technical analysis tools. Seasonality charts help identify cyclical patterns.
Pros & Cons
Pros:
- Free end-of-day version
- Professional-grade technical analysis tools
- Automated trading capabilities
- Strong European market coverage
- Paper trading included
Cons:
- Learning curve for coding strategies
- Real time data requires paid subscription
- Interface feels dated compared to modern platforms
- Support team primarily French-focused
Best For
European traders and those focused on forex markets. The free version makes it accessible for investors learning technical analysis before committing to paid subscriptions.
Other Notable Technical Analysis Software
Trade Ideas: Best for Day Trading
Price: Starting at $84/month
Trade Ideas excels at real-time market scanning. The Holly AI generates trading ideas based on historical data and current market conditions. For day traders who need lightning-fast scanning across thousands of stocks, Trade Ideas justifies its higher price.
The platform focuses more on scanning than traditional technical analysis tools. Most traders pair it with TradingView for charting while using Trade Ideas for finding opportunities.
MetaTrader 5: Best for Forex
Price: Free (requires broker account)
MetaTrader 5 dominates forex and automated trading. The platform includes essential technical indicators, unlimited charts, and MQL programming for custom indicators. The algorithmic trading capabilities let you create automated trading systems.
The interface looks dated compared to modern platforms, but the functionality is comprehensive. It’s free to download, but you’ll need an account with a broker that supports MetaTrader 5.
NinjaTrader: Best for Futures
Price: Free (for simulation) / $720-$1,299 (lifetime license)
NinjaTrader specializes in futures trading with deep market data for futures contracts. The platform includes strong technical analysis tools, advanced charting, and sophisticated order routing for complex setups.
The lifetime license model differs from monthly subscriptions, which some traders prefer for long-term cost management.
How to Choose Your Technical Analysis Software
For Beginners: TradingView’s free plan. Learn basic technical analysis without cost. Use paper trading to practice without risk.
For Day Traders: Trade Ideas for scanning paired with TradingView for charts. The combination gives fast opportunity identification plus solid technical analysis.
For Swing Traders: TrendSpider offers automation and technical analysis tools. The multi timeframe analysis saves hours weekly at $49.95/month.
For Technical Purists: TradingView Pro or TrendSpider depending on manual vs automated preference.
For Fundamental Traders: Koyfin combines technical and fundamental analysis. Makes trading decisions based on company data and price action.
For Forex Traders: ProRealTime or MetaTrader 5 offer strong forex capabilities.
For Futures Traders: NinjaTrader provides specialized tools for futures markets.
Common Mistakes With Technical Analysis
The biggest mistake is focusing on software instead of developing trading strategies first. No technical analysis software prevents you from losing money if your strategy is flawed.
Key lessons:
- More technical indicators don’t equal better trading decisions
- Backtesting helps, but past performance doesn’t guarantee future results
- Use paper trading before risking real capital
- Market trend matters more than any single indicator
- Risk management beats perfect timing
Even professionals using the best technical analysis software lose money on individual trades. The goal is strategies that work over time.
Pricing and Value
Most traders start with free platforms. TradingView’s free version and ProRealTime’s end-of-day data provide value for learning technical analysis.
As trading evolves, paid platforms become cost-effective. A $50/month platform that saves you one bad trade monthly pays for itself. TrendSpider’s automation has prevented several poor entries.
Higher prices don’t always mean better results. TC2000 at $9.99/month offers great value for U.S. stock scanning. Match the platform to your needs rather than assuming price equals quality.
Technical Analysis Software FAQ
Which technical analysis software is best?
TrendSpider is the best technical analysis software for automated pattern recognition and multi timeframe analysis. However, the “best” depends on your focus. TradingView offers better community features. TC2000 provides superior value for U.S. scanning. ProRealTime excels for European markets. Choose based on markets you trade and whether you prefer automation or manual analysis.
Which technical analysis is the best?
No single technical analysis approach is “best.” Successful strategies combine multiple technical indicators. Moving averages identify trends. RSI and stochastic indicators show overbought/oversold conditions. Volume confirms price action. The best approach depends on your time frames, risk tolerance, and style. Most experienced traders use 3-5 reliable indicators rather than overwhelming complexity.
Can I make $1000 per day from trading?
Making $1000 daily from trading requires substantial capital and carries high risk. You’d typically need $100,000-$250,000 (assuming 1-4% daily returns). Most traders lose money, especially starting out. Even experienced traders have losing days. Focus first on consistent profitability with smaller amounts through paper trading before attempting large daily profit goals. Build capital gradually rather than chasing daily dollar targets.
What is the 7% rule in stock trading?
The 7% rule suggests selling any stock falling 7-8% below your purchase price to limit losses. This helps traders avoid holding losing positions hoping they’ll recover. Many successful traders use similar stop-loss rules to protect capital. However, the specific percentage should match your trading strategies and volatility of financial instruments you trade. The principle behind the rule, cutting losses quickly, matters more than the exact percentage.
Final Thoughts
The best technical analysis software matches your trading style without unnecessary complexity. My current setup includes TrendSpider for automation, TradingView for community insights, TC2000 for U.S. scanning, and Koyfin for fundamental research.
Starting recommendations:
Months 1-3: Free TradingView and ProRealTime. Learn technical analysis using paper trading. Focus on moving averages, support/resistance, and chart patterns before adding complexity.
Months 4-6: Upgrade to one paid platform. TradingView Pro for multi-asset. TC2000 for U.S. stocks. TrendSpider for automation.
Months 7+: Add specialized tools after proving consistent profitability.
Whether you trade stocks, forex, or futures, these technical analysis tools provide resources for informed trading decisions. Match the platform to your needs and avoid thinking software guarantees profits.
The best traders started with basic free platforms and upgraded once strategies proved effective. Technical analysis software amplifies your edge, it doesn’t create one.
For more resources, check our guides on stock screeners and AI stock trading software.